. 2013 May 24:4:94.
doi: 10.3389/fgene.2013.00094. eCollection 2013.

The Impact of Hemolysis on Cell-Free microRNA Biomarkers

Affiliations

The Impact of Hemolysis on Cell-Free microRNA Biomarkers

Michaela B Kirschner et al. Front Genet. .

Abstract

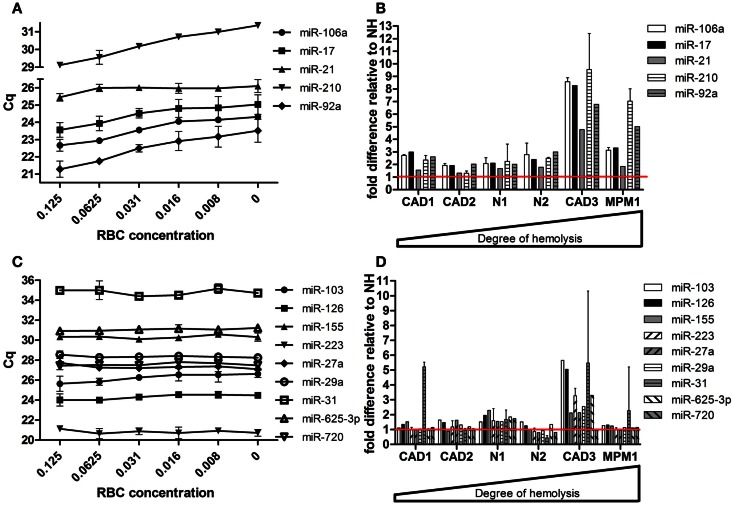
Cell-free microRNAs in plasma and serum have become a promising source of biomarkers for various diseases. Despite rapid progress in this field, there remains a lack of consensus regarding optimal quantification methods, reference genes, and quality control of samples. Recent studies have shown that hemolysis occurring during blood collection has substantial impact on the microRNA content in plasma/serum. To date, the impact of hemolysis has only been investigated for a limited number of microRNAs, mainly the red blood cell (RBC)-enriched miRs-16 and -451. In contrast, the effect of hemolysis on other microRNAs - in particular those proposed as biomarkers - has not been addressed. In this study we profiled the microRNA content of hemolyzed and non-hemolyzed plasma as well as RBCs to obtain a profile of microRNAs in the circulation affected or unaffected by hemolysis. Profiling by TaqMan Array Microfluidic Cards was used to compare three pairs of hemolyzed and non-hemolyzed plasma (with varying degrees of hemolysis) and one RBC sample. A total of 136 microRNAs were detectable in at least two of the samples, and of those 15 were at least twofold elevated in all three hemolyzed samples. This number increased to 88 microRNAs for the sample with the highest level of hemolysis, with all of these also detected in the RBC profile. Thus these microRNAs represent a large proportion of detectable microRNAs and those most likely to be affected by hemolysis. Several of the hemolysis-susceptible microRNAs (e.g., miRs-21, -106a, -92a, -17, -16) have also been previously proposed as plasma/serum biomarkers of disease, highlighting the importance of rigorous quality control of plasma/serum samples used for measurement of circulating microRNAs. As low-level hemolysis is a frequent occurrence during plasma/serum collection it is critical that this is taken into account in the measurement of any candidate circulating microRNA.

Keywords: biomarker; cell-free microRNA; hemolysis; quality control; red blood cells.


Figures

Figure 1
Figure 1
MicroRNA profiling of hemolyzed and non-hemolyzed plasma. (A) Summary of each pairs microRNA profile, representing the total number of microRNAs detectable as well as numbers of microRNAs affected or unaffected by hemolysis in each pair. (B) Heatmap of relative abundance of 136 microRNAs in hemolyzed compared to non-hemolyzed plasma. Levels of microRNAs in hemolyzed samples are presented as log2 of the relative expression level (non-hemolyzed = 0), with ±3.3 being the equivalent of a ±10-fold difference in relative abundance. The microRNAs presented are those detectable in at least four out of the six plasma samples investigated. (C) Overlap of microRNAs increased >2-fold in each of the three pairs. Fifteen microRNAs (inner triangle) were >2-fold increased in all three investigated pairs, and an additional 37 microRNAs were >2-fold increased in at least two of the investigated pairs.
Figure 2
Figure 2
Overview of microRNAs identified as being elevated in hemolyzed plasma or unaffected by hemolysis. The top 15 microRNAs are elevated in the hemolyzed sample of all three pairs, the following 37 microRNAs are elevated in two of the three pairs followed by the 36 microRNAs elevated in just one pair. The 11 microRNAs at the bottom of the list represent those with less than ±1.5-fold difference between the hemolyzed and non-hemolyzed sample.
Figure 2
Figure 2
Overview of microRNAs identified as being elevated in hemolyzed plasma or unaffected by hemolysis. The top 15 microRNAs are elevated in the hemolyzed sample of all three pairs, the following 37 microRNAs are elevated in two of the three pairs followed by the 36 microRNAs elevated in just one pair. The 11 microRNAs at the bottom of the list represent those with less than ±1.5-fold difference between the hemolyzed and non-hemolyzed sample.
Figure 3
Figure 3
RT-qPCR validation of candidates in dilution series of RBCs in plasma. (A) Previously identified hemolysis affected microRNAs (B) additional hemolysis affected microRNAs (C) RBC- and hemolyzed plasma specific microRNAs (D) unaffected microRNAs. Data are presented as raw Cq value ± SD obtained from measurements in RNA isolated from two independent dilution series.
Figure 4
Figure 4
Validation of microRNAs in matching pairs. (A) microRNAs changing with hemolysis (B) microRNAs not affected by hemolysis. Data are presented as relative microRNA level ± SD in the hemolyzed compared to the non-hemolyzed sample value obtained from measurements in RNA from two independent isolations per sample. The red line represents the relative expression of the corresponding non-hemolyzed samples.
Figure 5
Figure 5
Effect of hemolysis on biomarker candidates. Five proposed biomarker candidates were identified to be changing with increased hemolysis in (A) the RBC dilution series and (B) the six matching pairs of hemolyzed and non-hemolyzed plasma. Another nine proposed biomarkers remained unaffected by increasing hemolysis in both the dilution series (C) and the matched pairs (D). The red line represents the relative expression of the corresponding non-hemolyzed samples. Data are presented as raw Cq value ± SD (A,C) or relative microRNA level ± SD (B,D).

References

    1. Ali S., Almhanna K., Chen W., Philip P. A., Sarkar F. H. (2010). Differentially expressed miRNAs in the plasma may provide a molecular signature for aggressive pancreatic cancer. Am. J. Transl. Res. 3, 28–47 - PMC - PubMed
    1. Arroyo J. D., Chevillet J. R., Kroh E. M., Ruf I. K., Pritchard C. C., Gibson D. F., et al. (2011). Argonaute2 complexes carry a population of circulating microRNAs independent of vesicles in human plasma. Proc. Natl. Acad. Sci. U.S.A. 108, 5003–500810.1073/pnas.1019055108 - DOI - PMC - PubMed
    1. Blondal T., Jensby Nielsen S., Baker A., Andreasen D., Mouritzen P., Wrang Teilum M., et al. (2013). Assessing sample and miRNA profile quality in serum and plasma or other biofluids. Methods 59, S1–610.1016/j.ymeth.2012.12.011 - DOI - PubMed
    1. Brase J. C., Wuttig D., Kuner R., Sultmann H. (2010). Serum microRNAs as non-invasive biomarkers for cancer. Mol. Cancer 9, 306.10.1186/1476-4598-9-306 - DOI - PMC - PubMed
    1. Bruchova H., Yoon D., Agarwal A. M., Mendell J., Prchal J. T. (2007). Regulated expression of microRNAs in normal and polycythemia vera erythropoiesis. Exp. Hematol. 35, 1657–166710.1016/j.exphem.2007.08.021 - DOI - PMC - PubMed

LinkOut - more resources