Review
. 2013:82:471-96.
doi: 10.1146/annurev-biochem-051710-133623.

Hydrogen tunneling links protein dynamics to enzyme catalysis

Affiliations
Review

Hydrogen tunneling links protein dynamics to enzyme catalysis

Judith P Klinman et al. Annu Rev Biochem. 2013.

Abstract

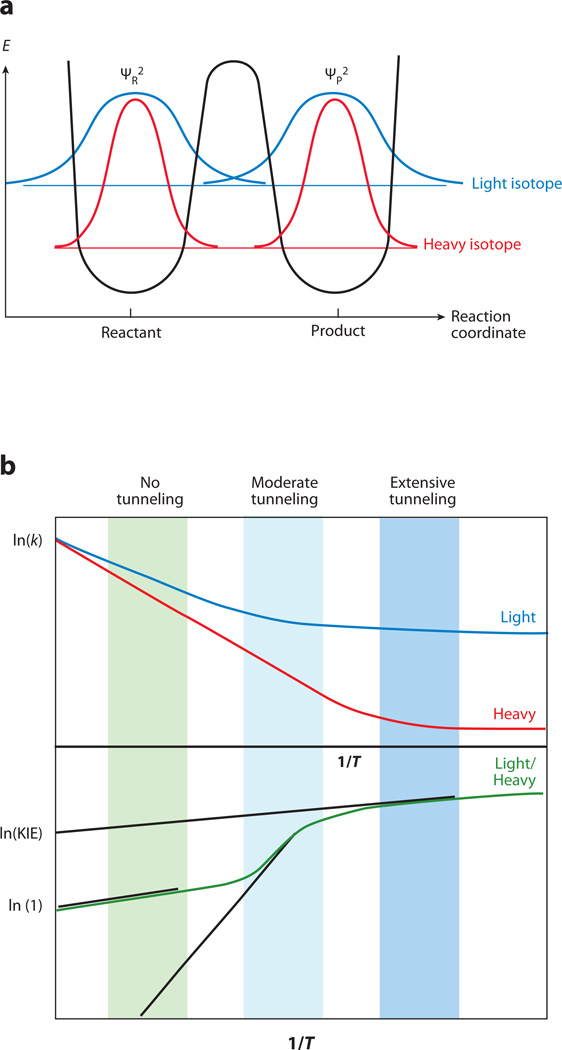
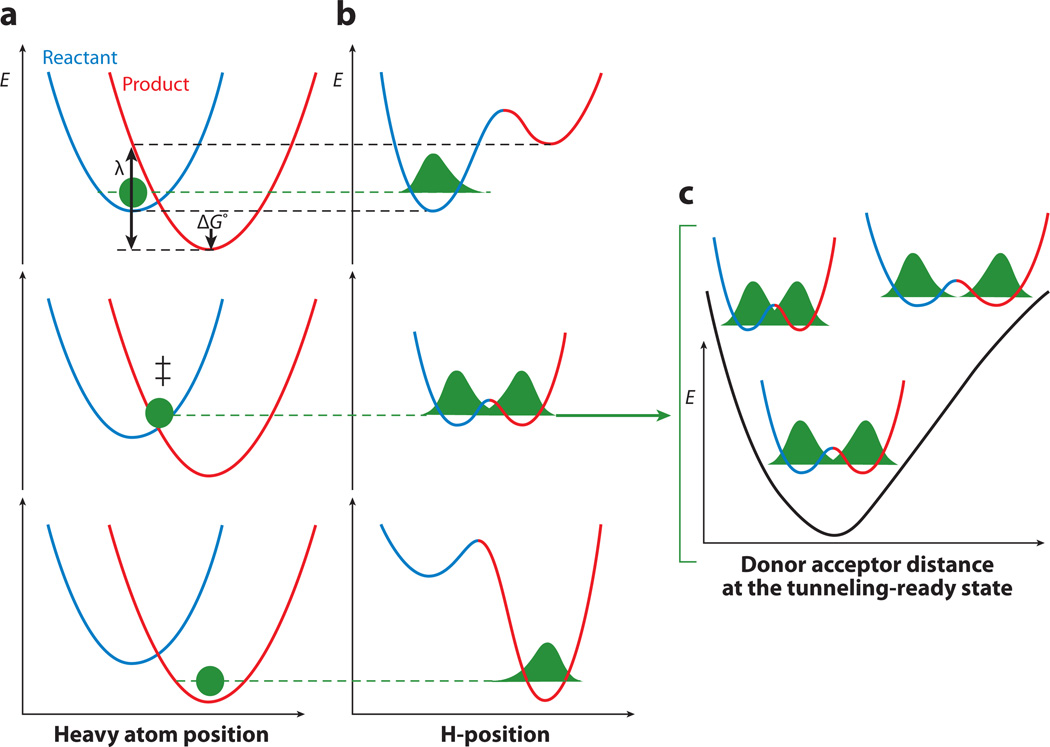
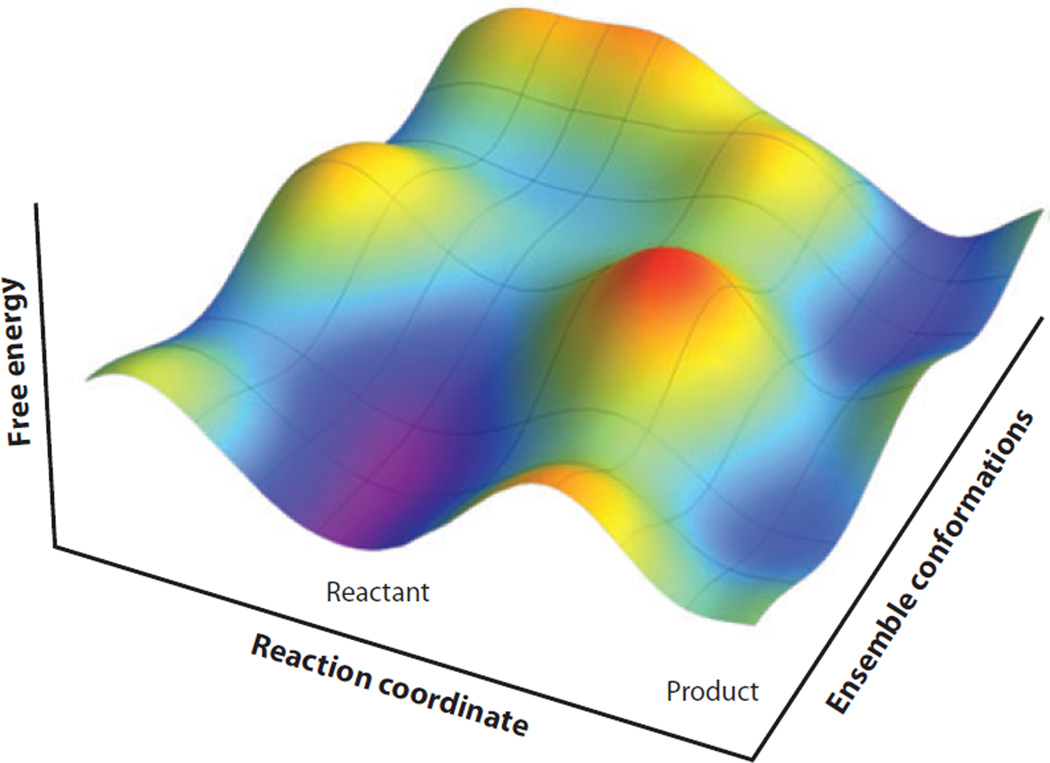
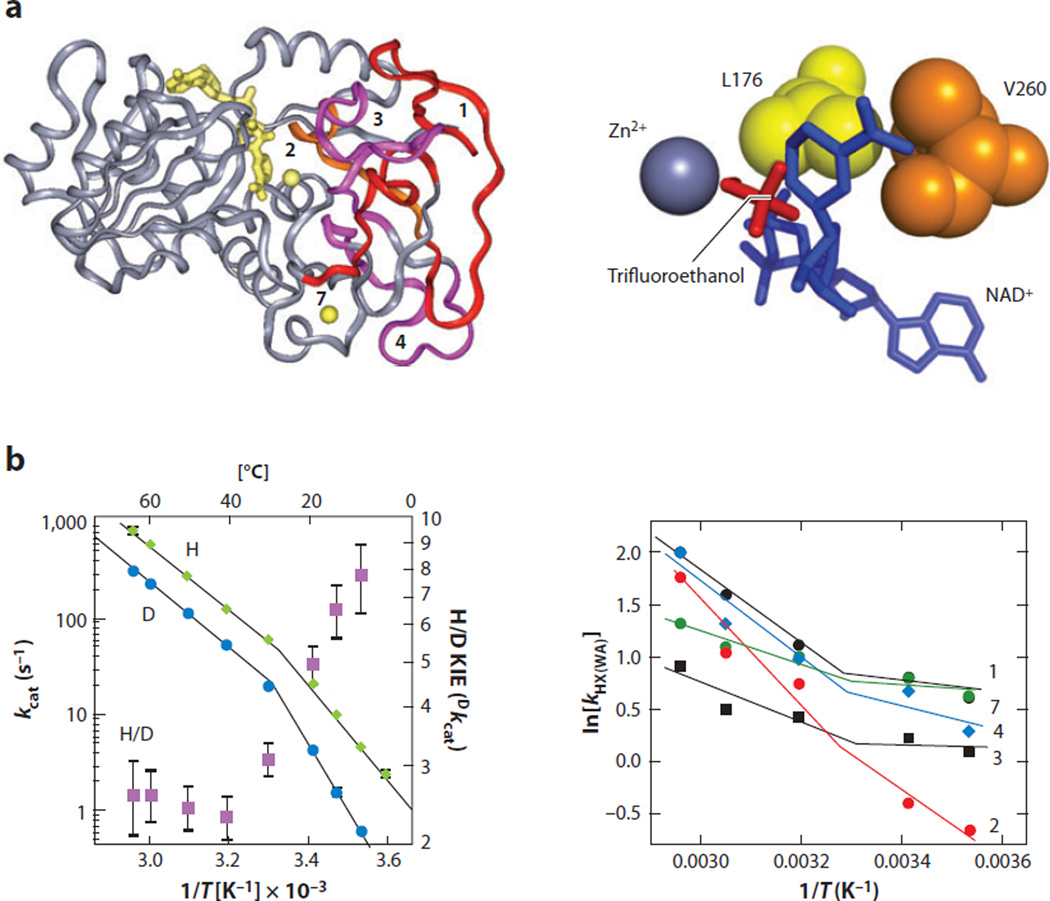
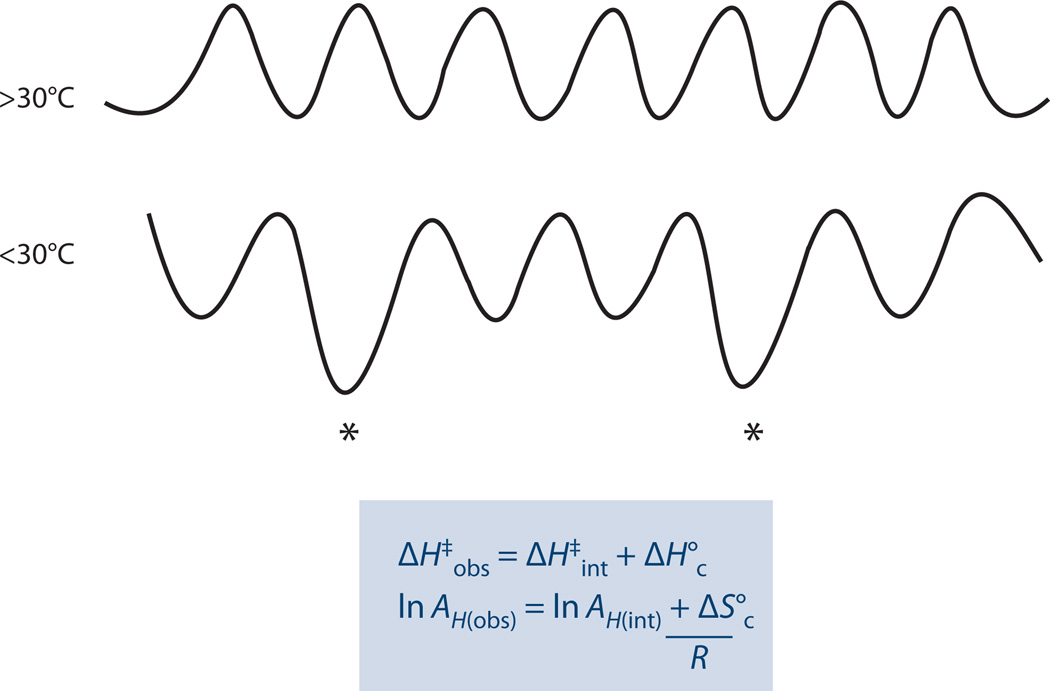
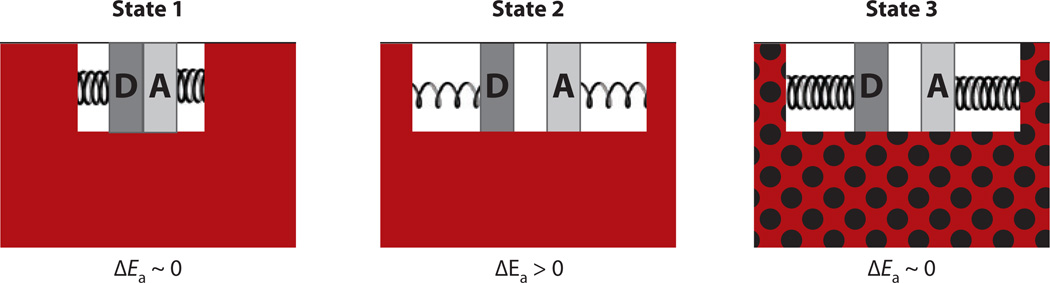
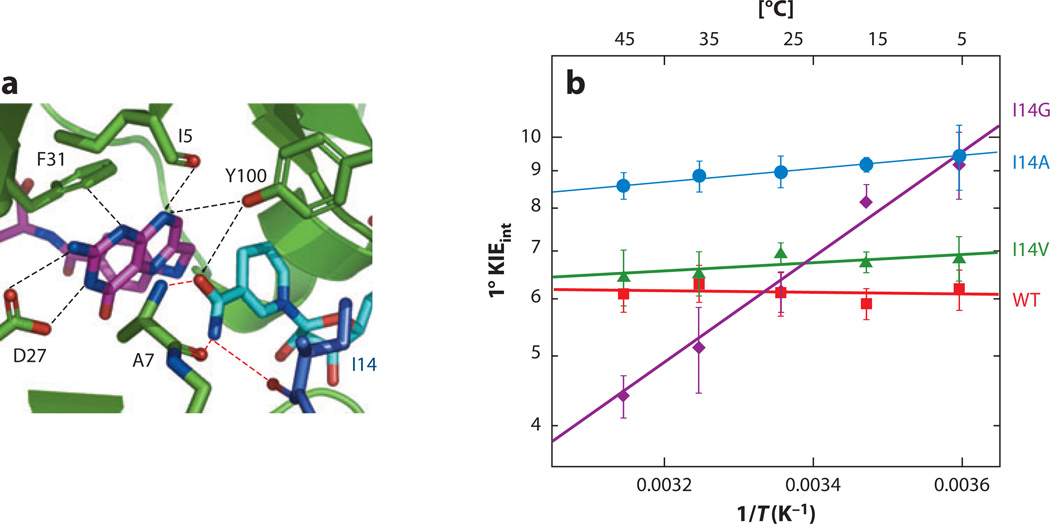
The relationship between protein dynamics and function is a subject of considerable contemporary interest. Although protein motions are frequently observed during ligand binding and release steps, the contribution of protein motions to the catalysis of bond making/breaking processes is more difficult to probe and verify. Here, we show how the quantum mechanical hydrogen tunneling associated with enzymatic C-H bond cleavage provides a unique window into the necessity of protein dynamics for achieving optimal catalysis. Experimental findings support a hierarchy of thermodynamically equilibrated motions that control the H-donor and -acceptor distance and active-site electrostatics, creating an ensemble of conformations suitable for H-tunneling. A possible extension of this view to methyl transfer and other catalyzed reactions is also presented. The impact of understanding these dynamics on the conceptual framework for enzyme activity, inhibitor/drug design, and biomimetic catalyst design is likely to be substantial.


Figures

Figure 1
Figure 1
(a) Illustration of a ground-state quantum mechanical tunneling for light and heavy isotopes. Reprinted with permission from Acc. Chem. Res. Copyright © 1998, American Chemical Society (26). (b) An Arrhenius plot of a hydrogen transfer applicable to a semiclassical transition-state (TS) model with a tunneling correction. Arrhenius plot of reaction rates for two isotopes, light (blue line) and heavy (red line). Arrhenius plot for their kinetic hydrogen isotope effects (KIEs) ( green line). The KIE on the Arrhenius pre-exponential factor (A) is an intercept of a tangent (black line) to a curve at the experimental temperature range. Highlighted regions indicate three distinct systems: no tunneling contribution, in which Al/Ah is close to unity; moderate tunneling contribution, resulting in Al/Ah smaller than 1; and extensive tunneling contribution, in which Al/Ah is larger than unity. Reproduced with permission from Chem. Biol. Copyright © 1999, American Chemical Society (59). Abbreviations: E, energy; P, product; R, reactant; ψ, wave function probability.
Figure 2
Figure 2
Marcus-like models of H-tunneling. Three slices of the potential energy surface along components of the collective reaction coordinate, showing the effect of heavy-atom motions on the zero-point energy in the reactant (blue) and product (red ) potential well. Panel a presents the heavy atoms’ coordinate, and panel b the H-atom position. In the top graphs, the hydrogen is localized in the reactant well. Heavy-atom reorganization brings the system to the tunneling-ready state (TRS; middle graphs in panels a and b), in which the zero-point energy levels in the reactant and product wells are degenerate and the hydrogen can tunnel between the wells as a function of the donor-acceptor distance (DAD), represented within E(rx) in Equation 4. The rate of reaching the TRS depends on the reorganization energy (λ) and driving force (ΔG°). Further heavy-atom reorganization breaks the transient degeneracy and traps the hydrogen in the product state (bottom graphs). The tunneling of the particle is essentially instantaneous in the context of these and other heavy-atom motions. Panel c presents the effective potential surface along the DAD coordinate at the TRS and shows the effect of DAD sampling on the wave function overlap at the TRS. Adapted from Reference .
Figure 3
Figure 3
Schematic representation of a free-energy landscape for an enzyme reaction. Protein motions occur along both axes. The reaction coordinate axis corresponds to the local environmental reorganization that facilitates the chemical reaction. In contrast, the ensemble conformations axis represents the sampling of multiple substates that occur at all stages along the reaction coordinate. The reactant and product valleys represent the ground states before and after the chemical conversion, and the dividing surfaces between them (maxima along the reaction coordinate) represent the ensemble of TRSs, or more generally, of the TS. This figure was produced by Dr. Russell Larsen and is printed here with permission.
Figure 4
Figure 4
Identification of the regions of thermophilic alcohol dehydrogenase (ht-ADH) that are more flexible above 30°C. Hydrogen/deuterium (H/D) exchange coupled to mass spectrometric analyses of protein-derived peptide shows five peptides that undergo a temperature-dependent transition between 10°C and 65°C, analogous to the temperature dependence of the kcat and KIE. (a, left) The five peptides are mapped onto the ht-ADH structure and colored red/orange/magenta over a gray background. The active-site Zn2+ is shown as a yellow ball near peptide two, and the cofactor NAD+ is modeled into the active site (also in yellow). Reprinted with permission from Proc. Natl. Acad. Sci. USA. Copyright © 2004, National Academy of Sciences USA (119). (a, right) The active-site hydrophobic side chains (Leu176 and Val260) that sit behind the nicotinamide ring of cofactor are illustrated. Reprinted with permission from Biochemistry. Copyright © 2012, American Chemical Society (123). (b) The 30°C transition in behavior occurs in kcat, Dkcat, and kHX(WA); the third is the weighted average rate constant for the multiexponential exchange of deuterium from solvent into the peptide backbone. The temperature dependence of kcat and Dkcat is on the left, and the temperature dependence of kHX(WA) is on the right. Panel b (left) reproduced with permission from Nature. Copyright © 1999, Nature Publishing Group (77). Panel b (right) reproduced with permission from Proc. Natl. Acad. Sci. USA. Copyright © 2004, National Academy of Sciences USA (119).
Figure 5
Figure 5
Illustration of a perturbed landscape for conformational sampling that explains the greatly elevated values for Ah in ht-ADH below 30°C. The trapping of the mutant protein at low temperatures into noncatalytic or low catalytic conformational states (asterisks) is expected to affect both ΔH and Ah in the manner observed. In the equations, ΔH int and ln Ah(int) represent the expected parameters in the absence of the energetics required to exit from the low catalytic conformational states (asterisk) (cf. 122).
Figure 6
Figure 6
A model to illustrate the impact of active-site mutations in ht-ADH above and below the transition temperature at 30°C, ΔEa = Ea(h) − Ea(l), according to Equation 3. State 1 is the ideal state and represents the wild-type (WT) protein above 30°C. The protein is optimally flexible (red region), and this generates active-site compression accompanied by a close approach of the H-donor and -acceptor. State 2 represents the situation following active-site mutation above 30°C. The white region, representing the active site, is artificially enlarged to allow a depiction of the resulting increased distance between the H-donor and -acceptor that is accompanied by a decrease in the force constant for DAD sampling. State 3 is the situation that results from the combination of active-site mutation and low temperature (black dots on red region). Once again, the region representing the active site (white) is enlarged to allow depiction of the increase in distance between the H-donor and -acceptor. Under these conditions, the increased rigidity of the protein below 30°C is proposed to prevent any recovery via DAD sampling. Adapted from Reference .
Figure 7
Figure 7
(a) Active site of WT DHFR (dihydrofolate reductase) from Escherichia coli [Protein Data Bank (PDB) ID 1RX2] emphasizing the role of Ile14 (metallic blue) as a support of the nicotinamide ring of NADP+. The nicotinamide ring is highlighted in light blue and the folate in magenta. (b) Arrhenius plot of intrinsic H/T KIEs (on a log scale) for WT DHFR (red ), I14V DHFR mutant ( green), I14A DHFR (blue), and I14G DHFR ( purple). The lines represent the nonlinear regression to an exponential equation. Reproduced with permission from J. Am. Chem. Soc. Copyright © 2012, the American Chemical Society (92).

References

    1. Pauling L. Chemical achievement and hope for the future. Am. Sci. 1948;36:51–58. - PubMed
    1. Wolfenden R. Degrees of difficulty of water-consuming reactions in the absence of enzymes. Chem. Rev. 2006;106:3379–3396. - PubMed
    1. Hilvert D. Critical analysis of antibody catalysis. Annu. Rev. Biochem. 2000;69:751–793. - PubMed
    1. Boehr DD, Dyson HJ, Wright PE. Conformational relaxation following hydride transfer plays a limiting role in dihydrofolate reductase catalysis. Biochemistry. 2008;47:9227–9233. - PMC - PubMed
    1. Hammes-Schiffer S, Benkovic SJ. Relating protein motion to catalysis. Annu. Rev. Biochem. 2006;75:519–541. - PubMed

Publication types