. 2013 Jun 4;104(11):2392-400.
doi: 10.1016/j.bpj.2013.04.034.

Structural flexibility of CaV1.2 and CaV2.2 I-II proximal linker fragments in solution

Affiliations

Structural flexibility of CaV1.2 and CaV2.2 I-II proximal linker fragments in solution

Lior Almagor et al. Biophys J. .

Abstract

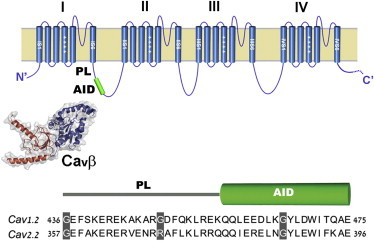
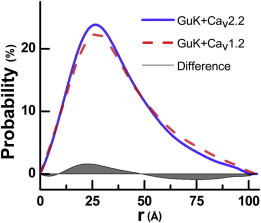
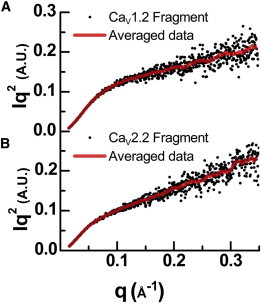
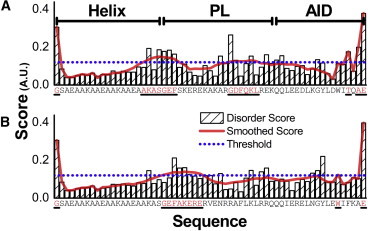
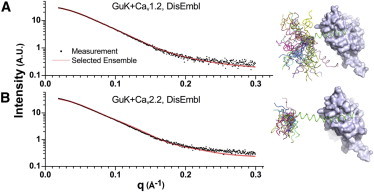
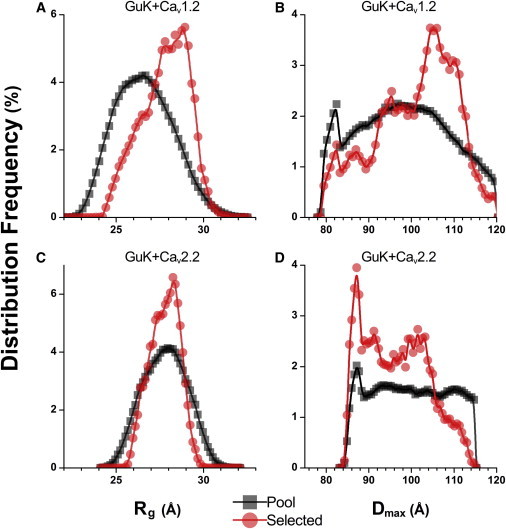
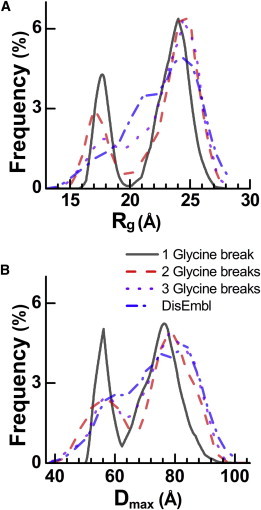
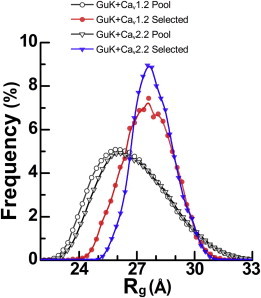
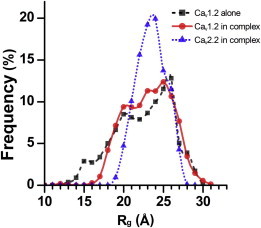
Voltage-dependent calcium channels (CaV) enable the inward flow of calcium currents for a wide range of cells. CaV1 and CaV2 subtype α1 subunits form the conducting pore using four repeated membrane domains connected by intracellular linkers. The domain I-II linker connects to the membrane gate (IS6), forming an α-helix, and is bound to the CaVβ subunit. Previous studies indicated that this region may or may not form a continuous helix depending on the CaV subtype, thereby modulating channel activation and inactivation properties. Here, we used small-angle x-ray scattering and ensemble modeling analysis to investigate the solution structure of these linkers, extending from the membrane domain and including the CaVβ-binding site, called the proximal linker (PL). The results demonstrate that the CaV1.2 PL is more flexible than the CaV2.2 PL, the flexibility is intrinsic and not dependent on CaVβ binding, and the flexibility can be most easily explained by the presence of conserved glycines. Our analysis also provides a robust example of investigating protein domains in which flexibility plays an essential role.


Figures

Figure 1
Figure 1
CaVα1 subunits and the location of the I-II PL. Top: Cartoon depiction of CaVα1 subunits and the location of the I-II PL and AID. Bottom: Schematic of the Helix-PL-AID fragment used for SAXS analysis. Sequence alignment between the rabbit CaV1.2 and CaV2.2 PL-AID regions.
Figure 2
Figure 2
Pair distribution probability functions, P(r), of CaV2.2 and CaV1.2 in complex with GuK. The GuK-helix-CaV2.2PL-AID complex (continuous line) is shown to be more compact than the GuK-Helix-CaV1.2PL-AID complex (dashed line). The gray area depicts the subtracted probabilities, showing increased probability in shorter distances and decreased probability in longer distances. This is indicative of a more compact conformation for the CaV2.2 complex.
Figure 3
Figure 3
(A and B) Kratky plots of the (A) CaV1.2 and (B) CaV2.2 fragments. Concentrations are 1 mg/ml and 0.4 mg/ml, respectively. The monotonous increase with q is a signature of disordered proteins. Scattered dots indicate the measured data, and lines display the smoothed running average.
Figure 4
Figure 4
(A and B) DisEMBL hot-loops prediction score for the (A) CaV1.2 and (B) CaV2.2 fragments. Striped bars: DisEMBL hot loops per residue score. Solid line: DisEMBL hot-loops scores smoothed with an eight-residue sliding window. Dotted line: Threshold for marking residues as disordered. Bars are labeled with the corresponding residue. Residues marked as disordered are highlighted and underlined. The CaV1.2 score indicates two major disorder regions: one is entirely contained within the PL domain and the other overlaps it. The CaV2.2 score indicates a single major disordered region at the start of the PL domain. The threshold is determined by the prediction algorithm’s expectation value for random input 0.86 multiplied by 1.4 for the reduction of false positives. Further details can be found in Linding et al. (24).
Figure 5
Figure 5
(A and B) SAXS intensity profiles for (A) GuK-CaV1.2 and (B) GuK-CaV2.2 complexes. The measured scattering intensities (scattered dots) are well described by an ensemble of conformations fit (line) using the DisEMBL prediction for disordered regions and the crystal structure for rigid regions. Solution background is subtracted in all measurements. The χ-values of the fittings were 1.32 and 3.2 for GuK-CaV1.2 and GuK-CaV2.2, respectively. The difference in χ-values is attributed to a difference in the measurement errors, as seen in the figure. To the right of the curves is a depiction of the respective PL ensembles superimposed using the bound GuK domain, shown as a surface representation.
Figure 6
Figure 6
Rg and Dmax distribution frequencies of EOM fitting for GuK in complex with CaV1.2 and CaV2.2. Square symbols denote distributions for 10,000 unique pool conformations, automatically constructed prior to fitting. Circle symbols denote distributions for 1000 nonunique ensemble conformations selected by EOM fitting. (A and C) Distributions for Rg. (B and D) Distributions for Dmax. (A and B) GuK in complex with Helix-CaV1.2 PL-AID. (C and D) GuK in complex with Helix-CaV2.2 PL-AID. The Rg and Dmax distributions for the GuK-CaV1.2 complex shift toward higher values relative to the GuK-CaV2.2 complex and the naive constructed pool. This indicates that GuK-CaV1.2 prefers longer conformations, whereas GuK-CaV 2.2 has little effect on probable conformations, with some preference toward a bent conformation for fully extended helices, as seen in the crystal structure.
Figure 7
Figure 7
(A and B) Comparison of Rg (A) and Dmax (B) distribution frequencies from EOM fitting for several disorder models of CaV1.2. Models shown: a single glycine joint at G449 (solid line); two glycine joints at G436, G449 (dashed line); three glycine joints at G436, G449, and G466 (dotted line); and DisEMBL predicted disorder based on the hot-loops score (dash-dotted line).
Figure 8
Figure 8
EOM fit map of combinatorial EOM runs based on two flexible joints of the CaV1.2 fragment. For clarity, each point in the map is color-coded according to 1/(χχ0), where χ represents the discrepancy between the EOM fit and the experimental data, and χ0 is set to 0.809. The correlation map is symmetric about the main diagonal with both axes having the CaV1.2 fragment amino acid sequence. Pairs of flexible joints within the PL region (highlighted sequence) are enclosed within green lines. The white diagonal lines correspond to a 13 amino acid separation between two joints that captures the best EOM fits and is within proximity to the predicted DisEmbl flexible regions (underlined in red).
Figure 9
Figure 9
Rg distribution frequencies calculated from the EOM-selected ensemble of conformations for the CaV2.2 fragment in complex with GuK, and for the CaV1.2 fragment in complex with GuK when the whole PL is modeled as flexible. EOM pool Rg distributions are denoted as open symbols, with GuK-CaV1.2 as circles and GuK-CaV2.2 as triangles. Selected conformations for GuK-CaV1.2 (solid circles) span a wider range of Rg values, with a significant population of conformations at lower Rg values compared with GuK-CaV2.2 (solid triangles). The Rg pool distributions appear roughly the same.
Figure 10
Figure 10
Effect of the GuK domain on CaV1.2 and CaV2.2 fragment conformation. Plotted are the Rg distribution frequencies of the isolated Helix-PL-AID components derived from the EOM-selected ensemble of conformations for the CaV2.2 fragment in complex with GuK (dotted line) and the CaV1.2 fragment as an unbound monomer (dashed line) or in complex with GuK (solid line). The CaV2.2 fragment exhibits a preference for longer conformations relative to CaV1.2.

Similar articles

Cited by

  • The Role of Force Fields and Water Models in Protein Folding and Unfolding Dynamics.
    Fischer AM, Tichy A, Kokot J, Hoerschinger VJ, Wild RF, Riccabona JR, Loeffler JR, Waibl F, Quoika PK, Gschwandtner P, Forli S, Ward AB, Liedl KR, Zacharias M, Fernández-Quintero ML. Fischer AM, et al. J Chem Theory Comput. 2024 Mar 12;20(5):2321-2333. doi: 10.1021/acs.jctc.3c01106. Epub 2024 Feb 19. J Chem Theory Comput. 2024. PMID: 38373307 Free PMC article.

References

    1. Jones S.W. Overview of voltage-dependent calcium channels. J. Bioenerg. Biomembr. 1998;30:299–312. - PubMed
    1. Buraei Z., Yang J.A. The β subunit of voltage-gated Ca2+ channels. Physiol. Rev. 2010;90:1461–1506. - PMC - PubMed
    1. Chen Y.H., Li M.H., Yang J. Structural basis of the α1-β subunit interaction of voltage-gated Ca2+ channels. Nature. 2004;429:675–680. - PubMed
    1. Opatowsky Y., Chen C.C., Hirsch J.A. Structural analysis of the voltage-dependent calcium channel β subunit functional core and its complex with the α1 interaction domain. Neuron. 2004;42:387–399. - PubMed
    1. Van Petegem F., Clark K.A., Minor D.L., Jr. Structure of a complex between a voltage-gated calcium channel β-subunit and an α-subunit domain. Nature. 2004;429:671–675. - PMC - PubMed

Publication types