. 2013 Jun 4;104(11):L22-4.
doi: 10.1016/j.bpj.2013.02.059.

Nanoscale distribution of ryanodine receptors and caveolin-3 in mouse ventricular myocytes: dilation of t-tubules near junctions

Affiliations

Nanoscale distribution of ryanodine receptors and caveolin-3 in mouse ventricular myocytes: dilation of t-tubules near junctions

Joseph Wong et al. Biophys J. .

Abstract

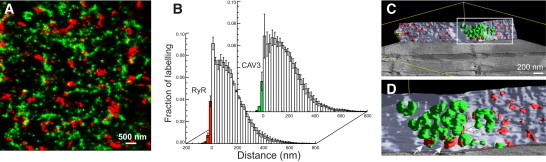
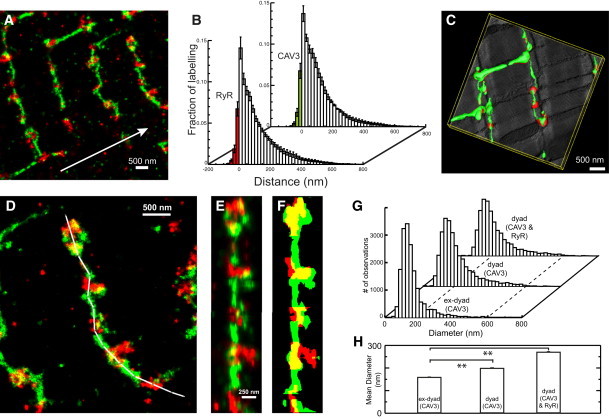
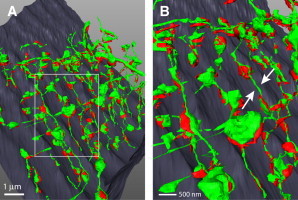
We conducted super-resolution light microscopy (LM) imaging of the distribution of ryanodine receptors (RyRs) and caveolin-3 (CAV3) in mouse ventricular myocytes. Quantitative analysis of data at the surface sarcolemma showed that 4.8% of RyR labeling colocalized with CAV3 whereas 3.5% of CAV3 was in areas with RyR labeling. These values increased to 9.2 and 9.0%, respectively, in the interior of myocytes where CAV3 was widely expressed in the t-system but reduced in regions associated with junctional couplings. Electron microscopic (EM) tomography independently showed only few couplings with caveolae and little evidence for caveolar shapes on the t-system. Unexpectedly, both super-resolution LM and three-dimensional EM data (including serial block-face scanning EM) revealed significant increases in local t-system diameters in many regions associated with junctions. We suggest that this regional specialization helps reduce ionic accumulation and depletion in t-system lumen during excitation-contraction coupling to ensure effective local Ca²⁺ release. Our data demonstrate that super-resolution LM and volume EM techniques complementarily enhance information on subcellular structure at the nanoscale.


Figures

Figure 1
Figure 1
Colocalization of CAV3 and RyRs at the surface sarcolemma. (A) Super-resolution micrograph of the distribution of CAV3 (green) and RyRs (red) at the surface of a mouse cardiac myocyte. (B) Analysis of the association of CAV3 with RyRs. The fraction of RyR labeling within CAV3 positive areas was ∼4.8% (front data) whereas ∼3.5% of CAV3 was found in RyR-positive membrane areas. (C) Segmented EM tomogram containing a patch of surface sarcolemma (light blue) and associated caveolae (green) as well as peripheral couplings (red). (D) Detailed view of a region with abundant caveolae. (Arrows) Couplings with caveolae.
Figure 2
Figure 2
Distribution of CAV3 and RyRs in the cell interior. (A) Super-resolution micrograph of CAV3 (green) and RyR (red) distribution at t-system. (Arrow) Direction of longitudinal cell axis. (B) Distance analysis of the CAV3 and RyR association (N = 6 cells per group). (C) Segmented EM tomogram of a similar region with three-dimensional mesh models of t-system membrane (green) and dyadic couplings (red). (D) This image illustrates the tracing (white path) of t-tubules. The label distribution was extracted and linearized along the path (E) to calculate a mask that shows the full width at quarter-maximum diameter along tubules, CAV3 (green) and RyR (red) (F). (G) Histograms of local diameters extracted from traced t-tubules. (H) Mean diameters in junctional (dyad) and nonjunctional (ex-dyad) regions. See main text and the Supporting Material for details. **p < 0.01.
Figure 3
Figure 3
Segmented SBFSEM data showing t-system dilations near dyadic junctions. (A) The overview shows t-system membranes (green) and jSR (red) in a mouse myocyte. (B, enlarged inset from panel A) Thin connecting tubules (arrows) and regular swellings in junctional regions at z-lines.

Comment in

References

    1. Franzini-Armstrong C., Protasi F. Ryanodine receptors of striated muscles: a complex channel capable of multiple interactions. Physiol. Rev. 1997;77:699–729. - PubMed
    1. Baddeley D., Jayasinghe I.D., Soeller C. Optical single-channel resolution imaging of the ryanodine receptor distribution in rat cardiac myocytes. Proc. Natl. Acad. Sci. USA. 2009;106:22275–22280. - PMC - PubMed
    1. Hayashi T., Martone M.E., Hoshijima M. Three-dimensional electron microscopy reveals new details of membrane systems for Ca2+ signaling in the heart. J. Cell Sci. 2009;122:1005–1013. - PMC - PubMed
    1. Scriven D.R.L., Klimek A., Moore E.D. Caveolin-3 is adjacent to a group of extradyadic ryanodine receptors. Biophys. J. 2005;89:1893–1901. - PMC - PubMed
    1. Jayasinghe I.D., Cannell M.B., Soeller C. Organization of ryanodine receptors, transverse tubules, and sodium-calcium exchanger in rat myocytes. Biophys. J. 2009;97:2664–2673. - PMC - PubMed

Publication types

Substances

LinkOut - more resources