. 2013 Jun 6;153(6):1219-1227.
doi: 10.1016/j.cell.2013.05.002.

Dynamics of hippocampal neurogenesis in adult humans

Affiliations

Dynamics of hippocampal neurogenesis in adult humans

Kirsty L Spalding et al. Cell. .

Abstract

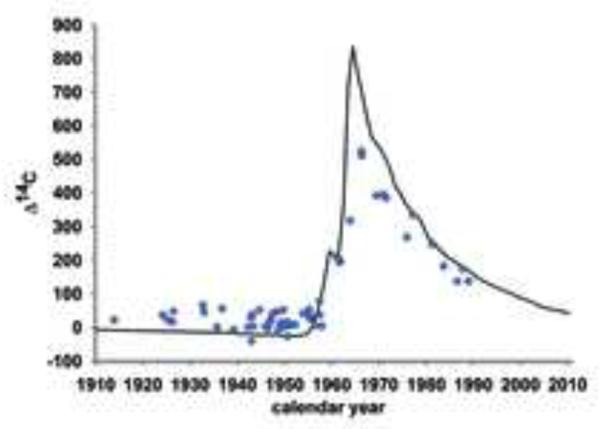
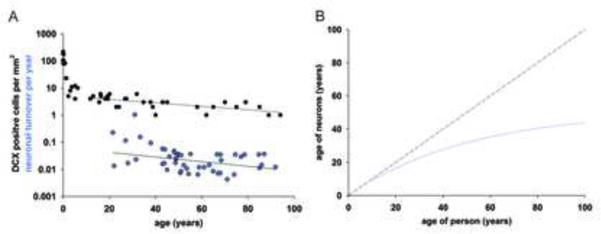
Adult-born hippocampal neurons are important for cognitive plasticity in rodents. There is evidence for hippocampal neurogenesis in adult humans, although whether its extent is sufficient to have functional significance has been questioned. We have assessed the generation of hippocampal cells in humans by measuring the concentration of nuclear-bomb-test-derived ¹⁴C in genomic DNA, and we present an integrated model of the cell turnover dynamics. We found that a large subpopulation of hippocampal neurons constituting one-third of the neurons is subject to exchange. In adult humans, 700 new neurons are added in each hippocampus per day, corresponding to an annual turnover of 1.75% of the neurons within the renewing fraction, with a modest decline during aging. We conclude that neurons are generated throughout adulthood and that the rates are comparable in middle-aged humans and mice, suggesting that adult hippocampal neurogenesis may contribute to human brain function.


Figures

Figure 1
Figure 1. Isolation of neuronal and non-neuronal nuclei from the human hippocampus
Cell nuclei were isolated from the human postmortem hippocampus and incubated with an isotype control antibody (A) or with an antibody against the neuron-specific epitope (NeuN) (B), and the neuronal and non-neural populations were isolated by flow cytometry. The sorting gate for neuronal nuclei is indicated.
Figure 2
Figure 2. Turnover dynamics of non-neuronal cells
(A) Schematic illustration of the representation of the measured 14C concentration in genomic DNA. The black line indicates the 14C concentration in the atmosphere at different time points in the last century. Individually measured 14C concentrations in genomic DNA of human hippocampal cells are plotted at the time of the subject's birth (vertical lines), before (green dot) or after the 14C bomb spike (orange dot). 14C concentrations above the bomb curve (subjects born before the bomb peak) and data points below the bomb curve (subjects born after the nuclear tests) indicate cellular turnover. (B) The 14C concentrations of genomic DNA from non-neuronal cells demonstrate post-natal cell turnover in subjects born before and after the bomb spike. (C) Individual turnover rates for non-neuronal cells computed based on individual data fitting. Individual turnover rate calculations are sensitive to deviations in measured 14C and values <0.001 or >1.5 were excluded from the plot, but the full data is given in Table S1. (D) Non-neuronal average cell age estimates of cells within the renewing fraction are depicted (red curve). The dashed line represents a no-cell-turnover scenario.
Figure 3
Figure 3. Hippocampal neurogenesis in adult humans
14C concentrations in hippocampal neuron genomic DNA correspond to a time after the date of birth of the individual, demonstrating neurogenesis throughout life.
Figure 4
Figure 4. Subpopulation dynamics of hippocampal neurons and non-neurons
(A) Hill function indicates that the fraction of neurons being exchanged is homogenous and confers to one mode of exchange. (B) In line with a non-neuronal population comprised of several cell types, the Hill function indicates that the nonneuronal cells form a heterogeneous group, with some subpopulations having high turnover rates and some very low. The z-axis indicates different possible solutions compatible with the data. Only solutions with a good fit are shown, with those with the highest probability indicated in red and lower probability in blue.
Figure 5
Figure 5. Neuronal turnover dynamics in the human hippocampus
(A) Individual turnover rates for neuronal cells within the renewing fraction were computed based on individual data fitting. The number of doublecortin (DCX)-positive cells per mm2 in the dentate gyrus (data from Knoth et al, 2010) shows a similar modest decline during adult ages as the computed neuronal turnover rates. Straight lines depict linear regression curves, with the regression line for DCX cell counts being calculated for individuals 10 years and older. Individual turnover rate calculations are sensitive to deviations in measured 14C and values <0.001 or >1.5 were excluded from the plot, but the full data is given in Table S1. (B) The average age of the neurons within the renewing fraction (blue curve). The dashed line represents the no-cell-turnover scenario.
Figure 6
Figure 6. An integrated model of the number and age of neurons in the human hippocampus
Schematic illustration of the number of neurons in the dentate gyrus (above the white line) and the other subdivisions of the hippocampus (below the white line), and the age of neurons within the dentate gyrus at different ages. The total number of neurons declines with age in the hippocampus, with the dentate gyrus being relatively spared. The dentate gyrus is composed of a declining fraction of cells generated during development (black), which is gradually replaced by postnatally generated cells. For a given age of the person, postnatally generated cells are in different shades of gray, indicating decade intervals, with the lightest gray being cells generated during the last decade, one shade darker being cells generated 10–20 years ago, and so on. This way, at age 15, among postnatally generated cells, only cells generated 0–10 years ago and 10–20 years ago are present. Read vertically, for a fixed age of the person, the cell age distribution goes from oldest cells (black) to the youngest ones (light gray). Read horizontally, the fraction of adult-born cells (non-black) increases with age. The model is based on Scenario 2POPEd. The figure was generated using parameters: initial fraction of renewing neurons: 0.31, death rate of the non-renewing neurons: 0.0035/year, death rate of newborn neurons: 0.11/year, cell age at which the death rate has reduced by half: 19 years. The parameter set was selected among the 3% best out of 3×10⁵ parameter sets explored using a Markov Chain Monte Carlo algorithm, and consistent with Scenario 2POP.

Comment in

References

    1. Amrein I, Isler K, Lipp HP. Comparing adult hippocampal neurogenesis in mammalian species and orders: influence of chronological age and life history stage. Eur J Neurosci. 2011;34:978–987. - PubMed
    1. Appleby PA, Kempermann G, Wiskott L. The role of additive neurogenesis and synaptic plasticity in a hippocampal memory model with grid-cell like input. PLoS computational biology. 2011;7:e1001063. - PMC - PubMed
    1. Arellano JI, Rakic P. Neuroscience: Gone with the wean. Nature. 2011;478:333–334. - PubMed
    1. Bayer SA. Neuron production in the hippocampus and olfactory bulb of the adult rat brain: addition or replacement? Ann N Y Acad Sci. 1985;457:163–172. - PubMed
    1. Ben Abdallah NM, Slomianka L, Vyssotski AL, Lipp HP. Early age-related changes in adult hippocampal neurogenesis in C57 mice. Neurobiology of aging. 2010;31:151–161. - PubMed

Publication types