. 2013 Jun 6;153(6):1239-51.
doi: 10.1016/j.cell.2013.05.016.

Posttranscriptional control of T cell effector function by aerobic glycolysis

Affiliations

Posttranscriptional control of T cell effector function by aerobic glycolysis

Chih-Hao Chang et al. Cell. .

Abstract

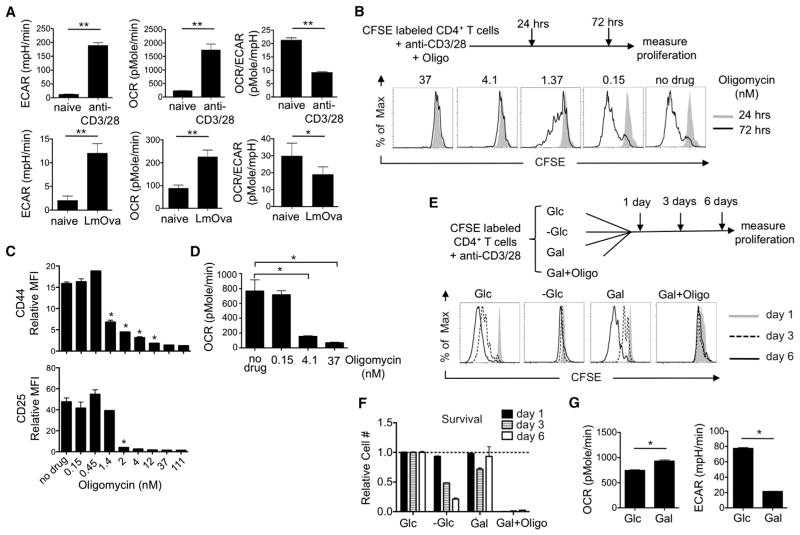
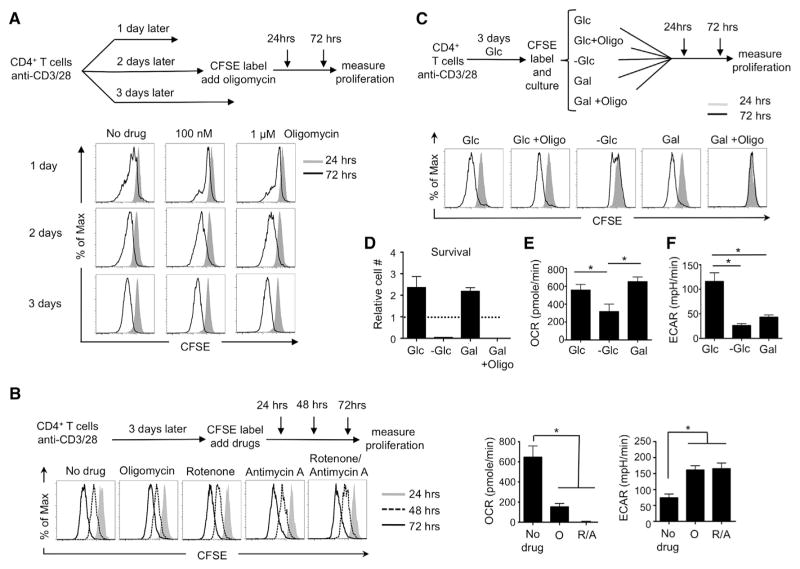
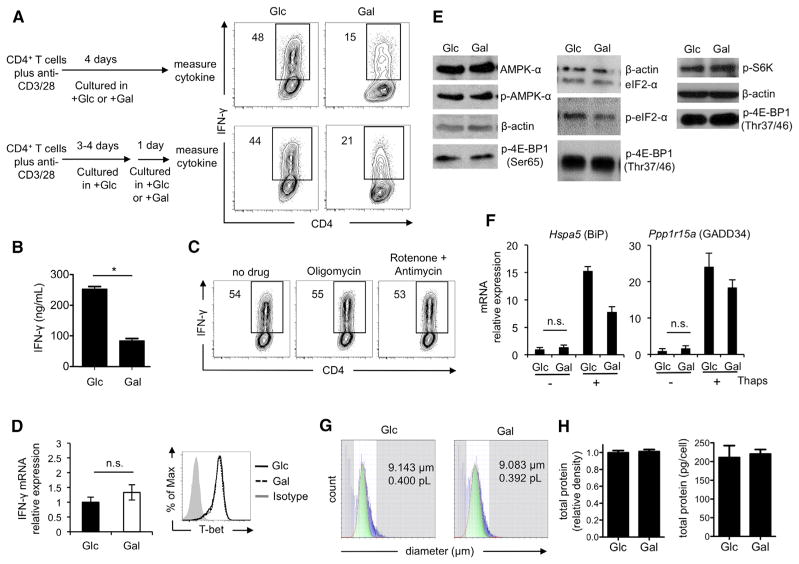
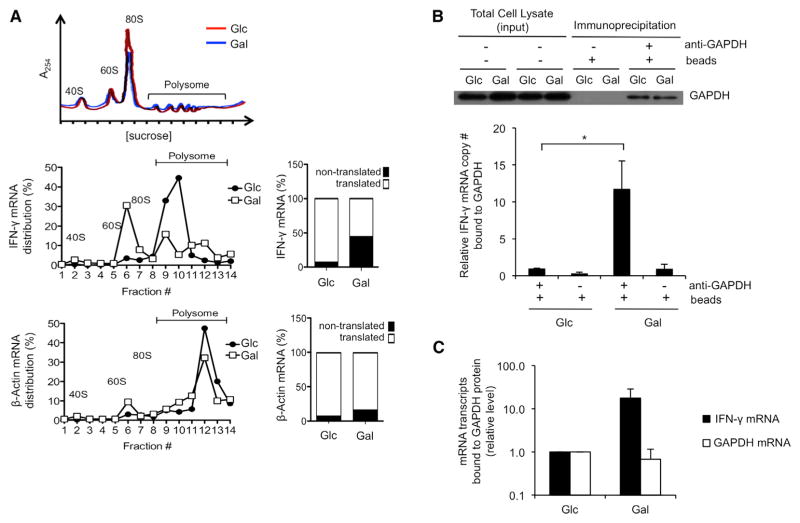
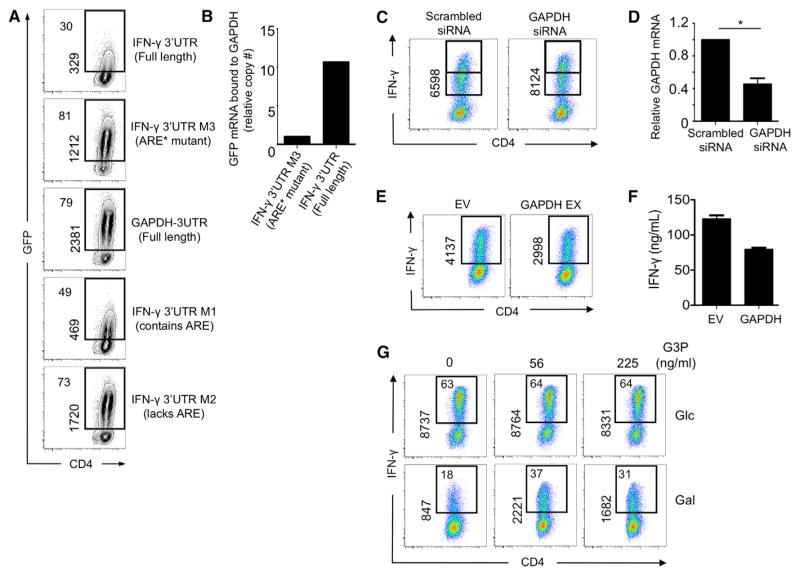
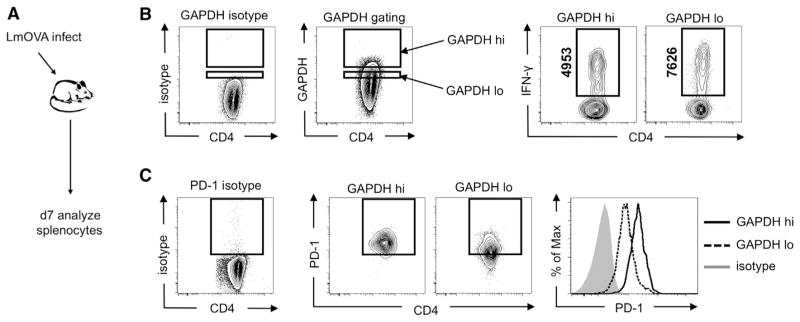
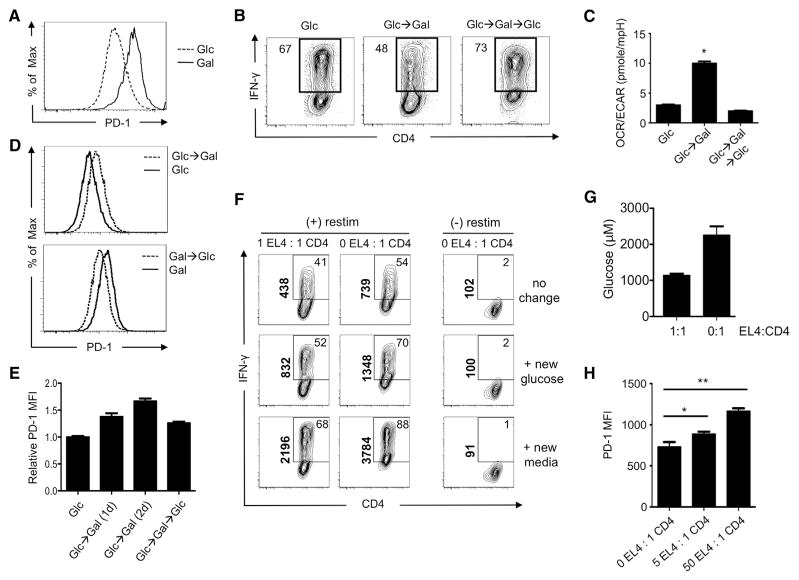
A "switch" from oxidative phosphorylation (OXPHOS) to aerobic glycolysis is a hallmark of T cell activation and is thought to be required to meet the metabolic demands of proliferation. However, why proliferating cells adopt this less efficient metabolism, especially in an oxygen-replete environment, remains incompletely understood. We show here that aerobic glycolysis is specifically required for effector function in T cells but that this pathway is not necessary for proliferation or survival. When activated T cells are provided with costimulation and growth factors but are blocked from engaging glycolysis, their ability to produce IFN-γ is markedly compromised. This defect is translational and is regulated by the binding of the glycolysis enzyme GAPDH to AU-rich elements within the 3' UTR of IFN-γ mRNA. GAPDH, by engaging/disengaging glycolysis and through fluctuations in its expression, controls effector cytokine production. Thus, aerobic glycolysis is a metabolically regulated signaling mechanism needed to control cellular function.


Figures

Figure 1
Figure 1. OXPHOS, but Not Aerobic Glycolysis, Is Required for the Activation of T Cells
(A) OCR and ECAR of naive and activated T cells were assessed. Activated CD4+ T cells were obtained from L. monocytogenes-infected mice or after in vitro stimulation with anti-CD3/28 for 72 hr. OCR/ECAR ratio of the cells was also determined; *p = 0.014 and **p < 0.0001. (B) CFSE-labeled naive T cells were activated with anti-CD3/28 in the presence or absence of oligomycin (Oligo) for indicated times, and then proliferation was measured by CFSE dilution. (C) Naive T cells were activated with anti-CD3/28 for 72 hr in the absence (no drug) or in the presence of oligomycin. The mean fluorescence intensity (MFI) of the activation markers CD44 and CD25 were determined and normalized to the level expressed in naive cells; *p = 0.001 for CD44, *p = 0.002 for CD25. (D) OCR of T cells that were activated with anti-CD3/28 and cultured in the presence of low concentrations of oligomycin for 3 days, *p = 0.0001. (E) CFSE-labeled naive T cells were activated with anti-CD3/28 and cultured in medium supplemented either with (+Glc) or without (−Glc) glucose or with galactose (+Gal),or galactose plus oligomycin (+Gal/Oligo) for 6 days. CFSE dilution was measured 1, 3, or 6 days after activation. (F) Live-cell (7AAD−) numbers of T cells were determined and normalized to the number of live cells cultured in glucose medium at the indicated times. (G) OCR and ECAR of T cells that were activated for 3 days with anti-CD3/28 and cultured in medium supplemented either with glucose (+Glc) or galactose (+Gal), *p = 0.0001. Data are representative of at least two independent experiments and depict mean ± SEM (error bars) of quadruplicates (A), (C), (D), (F), and (G) or of three independent experiments (B) and (E). See also Figure S1.
Figure 2
Figure 2. Activated T Cells Can Use Aerobic Glycolysis or OXPHOS Interchangeably to Fuel Proliferation and Survival
(A) Naive T cells were activated with anti-CD3/28 for 1, 2, or 3 days and were CFSE labeled and cultured with or without oligomycin. Proliferation was measured by CFSE dilution at 24 and 72 hr post-CFSE labeling. (B) Naive T cells were activated with anti-CD3/28 for 3 days. Cells were then CFSE labeled and cultured with mitochondrial inhibitors. Proliferation was measured by CFSE dilution at 24, 48, and 72 hr post-CFSE labeling (left), and OCR and ECAR were measured at 72 hr after culturing with or without mitochondrial inhibitors (O, oligomycin; R/A, rotenone and antimycin-A) (right). (C) Naive T cells were activated with anti-CD3/28 in glucose medium for 3 days, followed by CFSE labeling. The CFSE-labeled activated cells were then cultured in medium supplemented either with glucose (+Glc), glucose plus 1 μM oligomycin (Glc+Oligo), without glucose −Glc), or with galactose (+Gal), or galactose plus 4 nM oligomycin (Gal+Oligo). CFSE dilution was measured at 24 and 72 hr post-CFSE labeling. (D) Live-cell (7-AAD) numbers of activated CD4+ T cells were determined at 72 hr and normalized to the number of live cells cultured in glucose medium at 0 hr. (E and F) T cells were activated with anti-CD3/28 in glucose medium for 3 days. OCR and ECAR were measured 1 hr after these cells were switched into media with glucose (+Glc) or without glucose (−Glc) or with galactose (+Gal). Data are representative of at least three independent experiments (A), (B, left), and (C) or of two independent experiments and depict mean ± SEM (error bars) of quadruplicates (B, right), (D), (E), and (F); *p = 0.0001. See also Figures S1 and S2.
Figure 3
Figure 3. Aerobic Glycolysis Is Required for Optimal IFN-γ Cytokine Production in T Cells
(A) Intracellular IFN-γ was measured in T cells that were activated with anti-CD3/28 in medium containing either glucose (Glc) or galactose (Gal) for 4 days (top), or for 3 to 4 days in Glc followed by culture in Glc or Gal for 1 day (bottom, (B)–(H); or with oligomycin or rotenone/antimycin A for additional one day (C). (B) IFN-γ in the culture supernatant was measured by ELISA after restimulation. Frequencies of IFN-γ-producing cells are shown (A) and (C). (D) IFN-γ mRNA and T-bet expression. (E) Western blot analysis of p-4EBP1 and p-S6K and p-AMPK and p-eIF2-α were examined. (F) Hspa5 and Ppp1r15a expression after treatment with 0.1 mM thapsigargin (Thaps) for 4 hr. (G) Mean cell diameter and volume as measured by laser light-scattering method. (H) Total protein density (left) and total protein concentration (right) measured by Sypro Ruby staining and BCA assay, respectively. Plots in (A) and (C) are representative of >3 independent experiments; (B) graph shows the mean ± SEM (*p = 0.001) from two independent experiments; (D) qPCR data are generated from five independent experiments and are shown as mean ± SEM, n.s., not significant, and the FACS plot is representative of two independent experiments; (E) blots are representative of two to four independent experiments; (F) results are presented as mean ± SEM from six independent experiments for cells without Thaps treatment and from one experiment for cells with Thaps treatment; (G) data are representative of two independent experiments; and (H) data are presented as mean ± SEM from three independent experiments. See also Figure S3.
Figure 4
Figure 4. The Translational Defect in Cytokine Production Evident in the Absence of Aerobic Glycolysis Is Marked by Enhanced GAPDH Binding to IFN-γ mRNA
(A) Polysome analysis of T cells that were activated with anti-CD3/28 for 3 days in media containing glucose and then differentially cultured in media with either glucose (Glc) or galactose (Gal) for an additional day. The 40, 60, and 80S ribosomal subunits and polysomes were fractionated and monitored with continuous A254 measurements. A representative polysome profile of cells in Glc (red) and in Gal (blue) is shown in the upper panel. Total RNA was extracted from each fraction, and IFN-γ (middle) and β-actin (bottom) expression was measured by qPCR and calculated as a percentage of total RNA collected in all fractions. The proportion of each mRNA between nontranslated (1–7) and translated (8–14) fractions is plotted. Data are representative results from two independent experiments. (B) GAPDH-specific antibodies were used to immunoprecipitate GAPDH from extracts of activated T cells differentially cultured in media with either Glc or Gal. Bound GAPDH and associated mRNA were analyzed by western blot (top) and qRT-PCR (bottom). Total input per immunoprecipitation is shown (top). Data show results from six independent experiments as mean ± SEM (error bar) and are normalized to Glc cells (*p = 0.025). (C) IFN-γ mRNA transcripts and housekeeping gene transcripts (GAPDH mRNA) that bind to GAPDH protein in cells cultured in galactose (Gal) versus cells cultured in glucose (Glc). Relative levels were calculated by subtracting background binding (no primary antibody control) from primary antibody-specific binding and then normalizing to transcripts levels bound to GAPDH in Glc cells. Mean ± SEM (error bar) of three independent experiments. See also Figure S4.
Figure 5
Figure 5. GAPDH Associates with the AU-Rich Region of the IFN-γ 3′ UTR and Regulates IFN-γ Production
(A) T cells cultured in glucose (Glc) were transduced with UTR-sensor constructs for 2 days and then recultured in galactose (Gal) for 1 more day before GFP fluorescence was measured by flow cytometry. The percentage of GFP+ cells is depicted on the top left, and the MFI of those GFP+ events is shown vertically as indicated. (B) GAPDH-specific antibodies were used to immunoprecipitate GAPDH from extracts of indicated UTR-sensor construct-transduced T cells cultured in media with Gal. Associated GFP mRNA bound to GAPDH was analyzed by qRT-PCR. Data show results from one experiment that is normalized to the ARE* mutant IFN-γ 3′ UTR construct-transduced cells. (C) T cells were transfected with Scrambled or GAPDH siRNA. Cells were incubated for 24 hr before analyzing IFN-γ by flow cytometry. Shown vertically is the MFI of the events from IFN-γ-producing cells. Data show a representative result from seven independent experiments. (D) GAPDH expression was determined by qRT-PCR. Relative expression of GAPDH mRNA after Scrambled or GAPDH siRNA transfection is normalized to the GAPDH expression of Scrambled siRNA samples, p = 0.0049. Bar graph shown as the mean ± SEM (error bar) is generated from data from four independent experiments. (E and F) T cells were transduced with GAPDH (GAPDH EX) and empty vector control retrovirus (EV), and intracellular IFN-γ (E) and IFN-γ secretion by ELISA (F) were measured after restimulation. Dot plots show IFN-γ MFI from CD4+ T cells and are representative of three independent experiments; supernatant was collected from one experiment (mean ± SEM). (G) Activated T cells were exposed to varying concentrations of glyceraldehyde 3-phosphate (G3P) in 0.01% saponin on ice for 10 min prior to restimulation. Data represent similar results from three independent experiments. See also Figure S5.
Figure 6
Figure 6. Expression of GAPDH in CD4 T Cells Determines IFN-γ Production after Listeria monocytogenes Infection In Vivo
(A–C) A schematic is depicted (A) showing that mice were infected with L. monocytogenes, and splenocytes were analyzed 7 days later for GAPDH (B) and (C) and IFN-γ (B) and PD-1 (C) expression. Gating for high (GAPDH hi) and low (GAPDH lo) levels of GAPDH expression among GAPDH-positive cells, or PD-1 expression, was determined according to isotype controls. The mean fluorescence intensity of IFN-γ+ events is shown vertically as indicated. Data (B) and (C) are representative of at least two independent experiments.
Figure 7
Figure 7. Tumor Cells Impose a Nutrient Restriction on T Cells that Dampens IFN-γ Production
(A) T cells were activated with anti-CD3/28 in media containing glucose (Glc) or galactose (Gal), and PD-1 expression was measured. (B) Activated T cells were cultured in media containing Glc and then differentially cultured in either Glc or Gal (Glc→Gal) for 1 additional day. Cells cultured in Gal were then recultured in Glc for 1 more day (Glc→Gal→Glc). IFN-γ expression was measured 5 days postactivation. Frequencies of IFN-γ producing cells are shown, and plots are representative of three independent experiments. (C and D) The OCR over ECAR ratio (C) and PD-1 expression (D) of activated T cells cultured in indicated media as described in (B) were assessed. (E) Activated T cells were cultured in media containing Glc and then differentially cultured in either Glc or Gal for 1 additional day (Glc→Gal (1d)) or 2 days (Glc→ Gal (2d)). Cells cultured in Gal were then recultured in Glc for 1 more day (Glc→Gal→Glc). PD-1 expression was measured 5 days postactivation. Data are representative of at least two independent experiments (A), (B), and (D), and data are presented as mean ± SEM (error bar) from at least three independent experiments (C) and (E). *p = 0.0001. (F and G) (F) T cells were activated with anti-CD3/28 under Th1 polarizing conditions for 3 days. Cells were subsequently incubated overnight with equal numbers of Th1 cells alone or in a 50/50 mix of EL4 lymphoma cells: Th1 cells. Cells were restimulated (restim) and IFN-γ production (F) and glucose concentration in the media (G) were measured. At the time of restimulation, either nothing (no change), 10 mM glucose, or new media were added back to the cells. Data (F) and (G) are representative of three independent experiments. Data (G) are presented as mean ± SEM (error bar). (H) The MFI of PD-1 expression on T cells from the indicated coculture ratios of EL-4 lymphoma cells:Th1 cells are shown. Data are presented as mean ± SEM (error bar) from one experiment (n = 6). *p = 0.0423; **p = 0.0001. See also Figure S6.

Comment in

References

    1. Anderson P. Post-transcriptional regulons coordinate the initiation and resolution of inflammation. Nat Rev Immunol. 2010;10:24–35. - PubMed
    1. Arif A, Chatterjee P, Moodt RA, Fox PL. Heterotrimeric GAIT complex drives transcript-selective translation inhibition in murine macrophages. Mol Cell Biol. 2012;32:5046–5055. - PMC - PubMed
    1. Barber DL, Wherry EJ, Masopust D, Zhu B, Allison JP, Sharpe AH, Freeman GJ, Ahmed R. Restoring function in exhausted CD8 T cells during chronic viral infection. Nature. 2006;439:682–687. - PubMed
    1. Bonafé N, Gilmore-Hebert M, Folk NL, Azodi M, Zhou Y, Chambers SK. Glyceraldehyde-3-phosphate dehydrogenase binds to the AU-Rich 3′ untranslated region of colony-stimulating factor-1 (CSF-1) messenger RNA in human ovarian cancer cells: possible role in CSF-1 posttranscriptional regulation and tumor phenotype. Cancer Res. 2005;65:3762–3771. - PubMed
    1. Bustamente E, Morris HP, Pedersen PL. Hexokinase: the direct link between mitochondrial and glycolytic reactions in rapidly growing cancer cells. Adv Exp Med Biol. 1977;92:363–380. - PubMed

Publication types

Substances