. 2013 Jul 25;51(2):236-48.
doi: 10.1016/j.molcel.2013.05.003. Epub 2013 Jun 6.

The proto-oncometabolite fumarate binds glutathione to amplify ROS-dependent signaling

Affiliations

The proto-oncometabolite fumarate binds glutathione to amplify ROS-dependent signaling

Lucas B Sullivan et al. Mol Cell. .

Erratum in

  • Mol Cell. 2013 Jul 25;51(2):273

Abstract

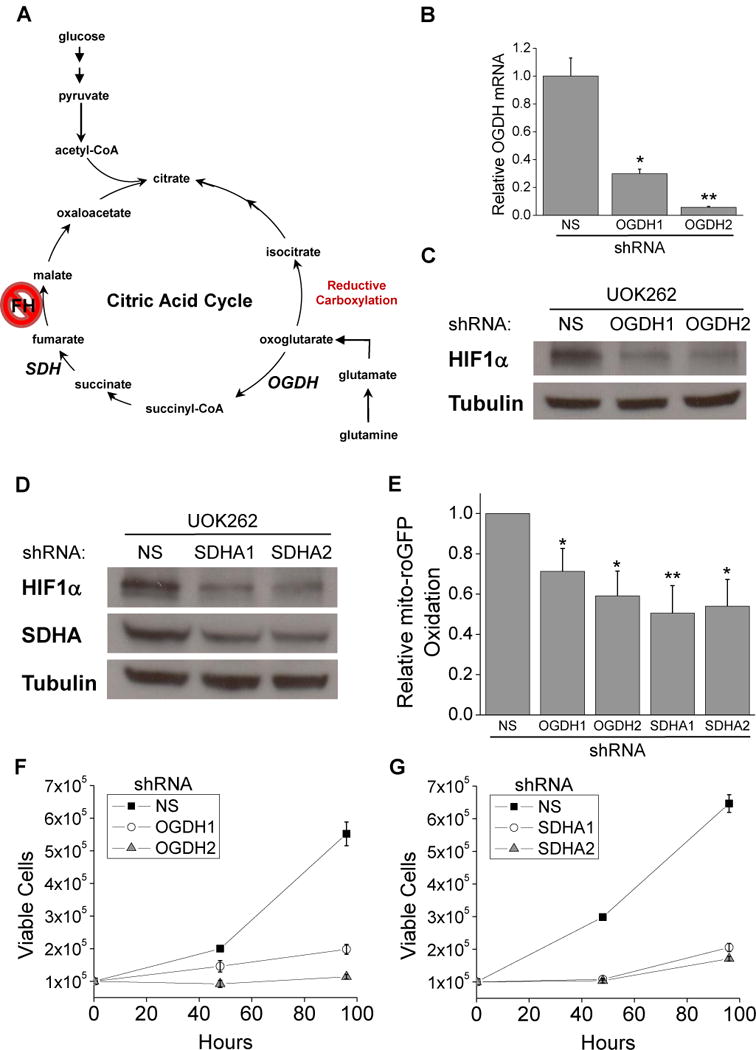
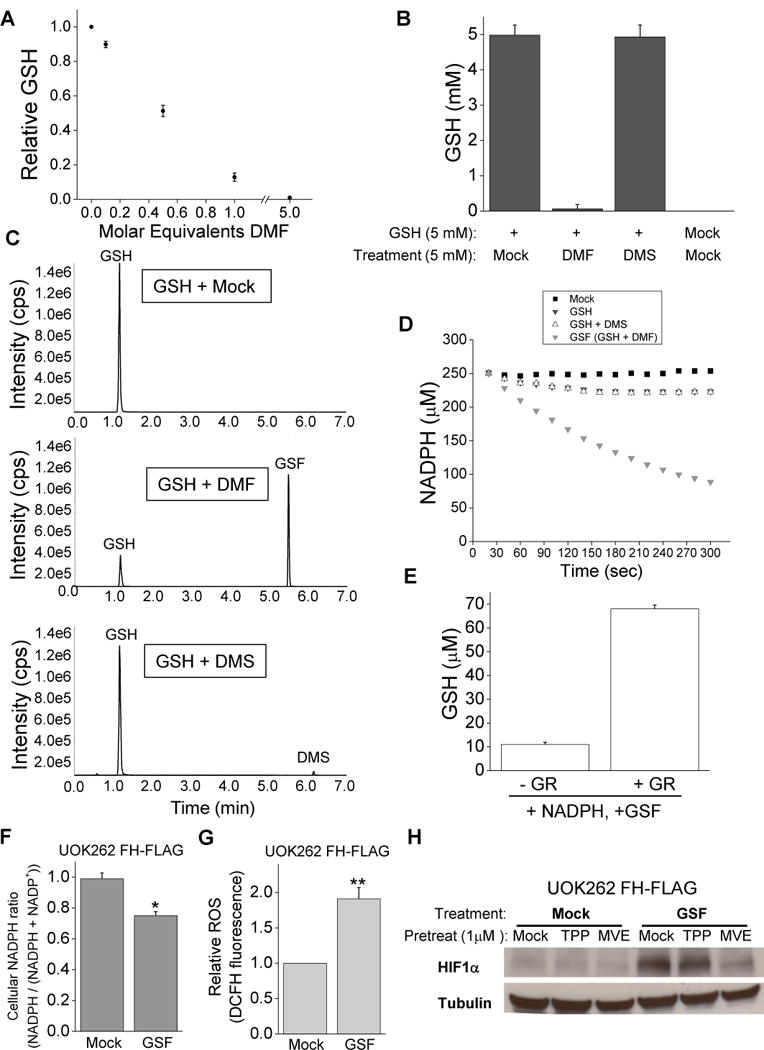
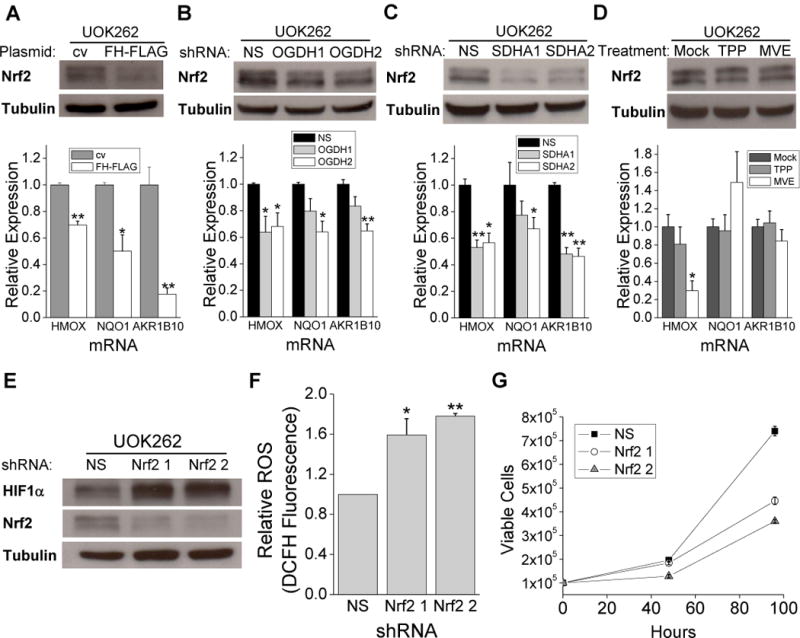
The tricarboxylic acid cycle enzyme fumarate hydratase (FH) has been identified as a tumor suppressor in a subset of human renal cell carcinomas. Human FH-deficient cancer cells display high fumarate concentration and ROS levels along with activation of HIF-1. The underlying mechanisms by which FH loss increases ROS and HIF-1 are not fully understood. Here, we report that glutamine-dependent oxidative citric acid cycle metabolism is required to generate fumarate and increase ROS and HIF-1 levels. Accumulated fumarate directly bonds the antioxidant glutathione in vitro and in vivo to produce the metabolite succinated glutathione (GSF). GSF acts as an alternative substrate to glutathione reductase to decrease NADPH levels and enhance mitochondrial ROS and HIF-1 activation. Increased ROS also correlates with hypermethylation of histones in these cells. Thus, fumarate serves as a proto-oncometabolite by binding to glutathione which results in the accumulation of ROS.


Figures

Figure 1
Figure 1
FH deficient cells stabilize HIF1α through high ROS signaling. (A) Subcellular fractionation of UOK262 FH-FLAG cells and western blot for FLAG, SDHA (mitochondrial marker) and tubulin (cytosolic marker). (B) Enzymatic FH activity from mitochondrial fractions of parental UOK262 cells and UOK262 cells expressing control vector (cv) or FH-FLAG. (C) GC-MS analysis showing fumarate concentrations in cv and FH-FLAG UOK262 cells. (D) Western blot for HIF1α, FLAG, and tubulin protein in cv or FH-FLAG UOK262 cells (E) Western blot for PDK1 and tubulin protein in cv or FH-FLAG UOK262 cells (F) Relative levels of oxidized mito-roGFP in cv and FH-FLAG UOK262 cells (G) Relative levels of mito-roGFP oxidation in mock, 1 μM TPP, and 1 μM MVE treated UOK262 cells. (H) Western blot for HIF1α and tubulin protein from UOK262 cells treated with mock treatment, 1 μM TPP, and 1 μM MVE. (I) Western blot for PDK1 and tubulin protein in UOK262 cells treated with mock treatment, 1 μM TPP, and 1 μM MVE. (J) The proliferative effects of treatment with mock treatment, 1 μM TPP, and 1 μM MVE after 48 hours and 96 hours. (K) Viability of cells treated with mock treatment, 1 μM TPP, or 1 μM MVE for 48 hours or 96 hours as determined by trypan blue exclusion. In (B, C, F, G, J, and K) the values denote mean + s.e.m. n = 3 (B, C, J, and K) n = 4 (F), n = 5 (G). *P < 0.05; **P < 0.01.
Figure 2
Figure 2
Oxidative metabolism of 2-oxoglutarate to fumarate is required for HIF1α stabilization, high ROS, and proliferation of UOK262 cells. (A) Schematic of the TCA cycle highlighting two enzymes, OGDH and SDH, which are responsible for the first and last step of the conversion of 2-oxoglutarate to fumarate. (B) Real-time PCR analysis of OGDH expression to check the efficacy of shRNA targeting of OGDH relative to NS control. (C) Western blot for HIF1α and tubulin protein in UOK262 cells expressing NS and OGDH shRNAs. (D) Western blot for HIF1α, SDHA, and tubulin protein in UOK262 cells expressing NS and SDHA shRNAs. (E) Relative levels of oxidized mito-roGFP in UOK262 cells treated with NS, OGDH, and SDHA shRNA. The proliferative effects of OGDH knockdown (F) and SDHA knockdown (G) were measured by plating cells at 105 cells per plate and cells were counted after 48 hours and 96 hours. In (B and E–G) the values denote mean + s.e.m. n = 3 (B, F, G), n = 5 (E). *P < 0.05; **P < 0.01.
Figure 3
Figure 3
Fumarate covalently bonds to glutathione in vitro and in FH null cells. (A) Proposed reaction whereby the cysteine on glutathione undergoes a nucleophilic attack on an alkene carbon of fumarate to form GSF. (B) MS/MS analysis of a mixture of 10 mM GSH and 10 mM fumaric acid (left) or 10 mM succinic acid (right) to determine if fumaric acid binds glutathione in vitro. Succinic acid lacks the reactive alkene of fumarate and thus served as a negative control. (C–E) Quantification of LC/MS/MS analysis of glutathione species extracted from cv and FH-FLAG UOK262 cells. (F) Measurement of NADPH ratio in mitochondrial fractions from cv and FH-FLAG UOK262 cells. In (C–F) the values denote mean + s.e.m. n = 3. *P < 0.05; **P < 0.01.
Figure 4
Figure 4
GSF is an alternative substrate for glutathione reductase. (A) Measurement of GSH after incubation with increasing concentrations of DMF in vitro for 3 hours. (B) Measurement of GSH after 1 hour of incubation under the listed conditions. (C) LC/MS/MS analysis of metabolites generated during a 1-hour incubation of the indicated metabolites. (D) Representative plot of measurement of NADPH concentration over time when mock solution, 5 mM GSH, 5 mM GSH + 5 mM DMF, or 5 mM GSH + 5 mM DMS were added to a solution of 250 μM NADPH and 0.05 U/ml glutathione reductase. (E) Measurement of GSH levels of solutions of GSF and NADPH with or without glutathione reductase. (F) Measurement of NADPH ratio in FH-FLAG UOK262 cells treated with mock treatment or 0.5 mM GSF for 3 hours. (G) Relative intracellular ROS level was determined by DCFH fluorescence in FH-FLAG UOK262 cells treated with mock treatment or 0.5 mM GSF for 3 hours. (H) Western blot for HIF1α and tubulin protein from FH-FLAG UOK262 cells pretreated for 21 hours with mock treatment, 1 μM TPP, and 1μM MVE and treated for 3 hours with mock treatment or 0.5 mM GSF. In (A) the values denote mean +/− s.e.m, n=3 while in (B, E–G) the values denote mean + s.e.m. n = 3. *P < 0.05; **P < 0.01.
Figure 5
Figure 5
Nrf2 is stabilized by fumarate and helps mitigate ROS. (A) Western blot for Nrf2 and tubulin protein and RT-PCR of Nrf2 target genes from cv and FH-FLAG UOK262 cells. (B) Western blot for Nrf2 and tubulin protein and RT-PCR of Nrf2 target genes from UOK262 cells expressing NS and OGDH shRNAs. (C) Western blot for Nrf2 and tubulin protein and RT-PCR of Nrf2 target genes from UOK262 cells expressing NS and SDHA shRNAs. (D) Western blot for Nrf2 and tubulin protein and RT-PCR of Nrf2 target genes from UOK262 cells treated with mock treatment, 1 μM TPP, and 1 μM MVE. (E) Western blot for HIF1α, Nrf2, and tubulin protein in UOK262 cells expressing NS or Nrf2 shRNAs. (F) Relative intracellular ROS level was determined by DCFH fluorescence in UOK262 cells expressing NS or Nrf2 shRNAs. (G) The proliferative effects of Nrf2 knockdown were measured after 48 hours and 96 hours. In (A–D, F, and G) the quantified values denote mean + s.e.m. n = 3. *P < 0.05; **P < 0.01.
Figure 6
Figure 6
ROS inhibit histone demethylation. (A) Representative western blot for histone methylation markers and H4 protein loading control from nuclear extracts of UOK262 cells expressing cv and FH-FLAG plasmids. (B) Densitometric quantification of histone methylation markers relative to H4 loading control of UOK262 cv and FH-FLAG cells. (C) Measurement of demethylase activity of JMJD2A in vitro in the presence of fumarate, succinate, and N-oxalylglycine (NOG). (D) Measurement of demethylase activity of JMJD2A in vitro in the presence H2O2. (E) Measurement of synergistic inhibition of JMJD2A in vitro in the presence or absence of 1 mM fumarate and various doses of H2O2. Values are relative to activity of mock or fumarate treated cells without H2O2. In (B–E) the values denote mean + s.e.m. n = 3. *P < 0.05; **P < 0.01.
Figure 7
Figure 7
Both FH and complex I dysfunction contribute to HIF1α stabilization, high ROS, loss of mitochondrial oxygen consumption, and reductive carboxylation in UOK262 cells. (A) Table describing the cell line labels and their associated plasmids. (B) Real-time PCR analysis of NDI expression. (C) Mitochondrial OCR for the four UOK262 cell lines. (D) Cell death from the four UOK262 cell lines after 24 hours in complete DMEM containing 10 mM glucose, or glucose free DMEM supplemented with 10 mM galactose, as determined by percent of cells that uptake propidium iodide. (E) Mitochondrial OCR for saponin permeabilized UOK262 cell lines when treated with 10 mM pyruvate and 2 mM malate. Rotenone sensitive fraction was measured by the decrease in OCR after addition of 2 μM rotenone. (F) Mitochondrial OCR for saponin permeabilized UOK262 cell lines when treated with 10 mM succinate. (G) Western blot for HIF1α and tubulin protein from the four UOK262 cell lines. (H) Relative levels of oxidized mito-roGFP from the four UOK262 cell lines. (I) GC/MS analysis of the mass isotopomer distribution of citrate in cells cultured with D[U-13C]glucose and unlabelled glutamine. (J) GC/MS analysis of the mass isotopomer distribution of citrate in cells cultured with L[U-13C]glutamine and unlabelled glucose. In (B–F, H) the values denote mean + s.e.m. In (I and J) the values denote mean + standard deviation. n = 3 (B, D, I, J), n = 5 (C, E, F), n = 6 (H). *P < 0.05; **P < 0.01 compared to cell line 1.

Comment in

References

    1. Adam J, Hatipoglu E, O’Flaherty L, Ternette N, Sahgal N, Lockstone H, Baban D, Nye E, Stamp Gordon W, Wolhuter K, et al. Renal Cyst Formation in Fh1-Deficient Mice Is Independent of the Hif/Phd Pathway: Roles for Fumarate in KEAP1 Succination and Nrf2 Signaling. Cancer Cell. 2011;20:524–537. - PMC - PubMed
    1. Alderson NL, Wang Y, Blatnik M, Frizzell N, Walla MD, Lyons TJ, Alt N, Carson JA, Nagai R, Thorpe SR, et al. S-(2-Succinyl)cysteine: A novel chemical modification of tissue proteins by a Krebs cycle intermediate. Arch Biochem Biophys. 2006;450:1–8. - PubMed
    1. Bardella C, El-Bahrawy M, Frizzell N, Adam J, Ternette N, Hatipoglu E, Howarth K, O’Flaherty L, Roberts I, Turner G, et al. Aberrant succination of proteins in fumarate hydratase-deficient mice and HLRCC patients is a robust biomarker of mutation status. J Pathol. 2011;225:4–11. - PubMed
    1. Blatnik M, Frizzell N, Thorpe SR, Baynes JW. Inactivation of Glyceraldehyde-3-Phosphate Dehydrogenase by Fumarate in Diabetes. Diabetes. 2008;57:41–49. - PMC - PubMed
    1. Cairns RA, Harris IS, Mak TW. Regulation of cancer cell metabolism. Nat Rev Cancer. 2011;11:85–95. - PubMed

Publication types

MeSH terms