. 2013 Jun 4;17(6):976-987.
doi: 10.1016/j.cmet.2013.04.020.

MICU1 controls both the threshold and cooperative activation of the mitochondrial Ca²⁺ uniporter

Affiliations

MICU1 controls both the threshold and cooperative activation of the mitochondrial Ca²⁺ uniporter

György Csordás et al. Cell Metab. .

Abstract

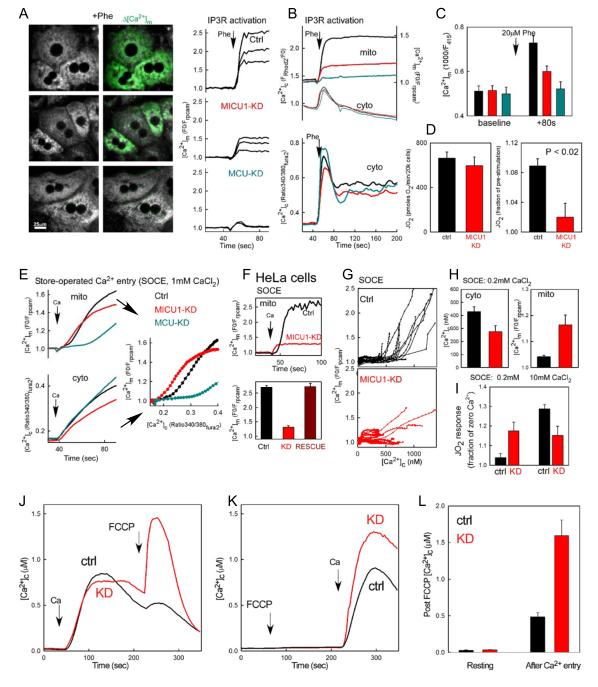
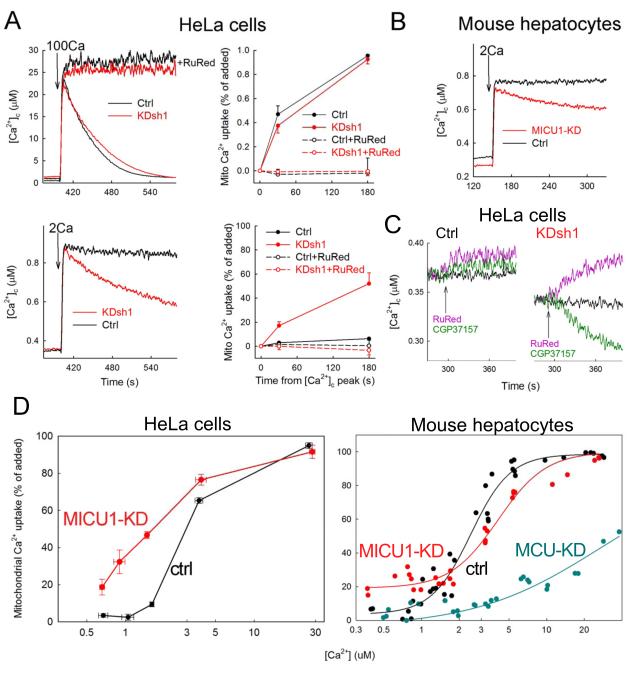
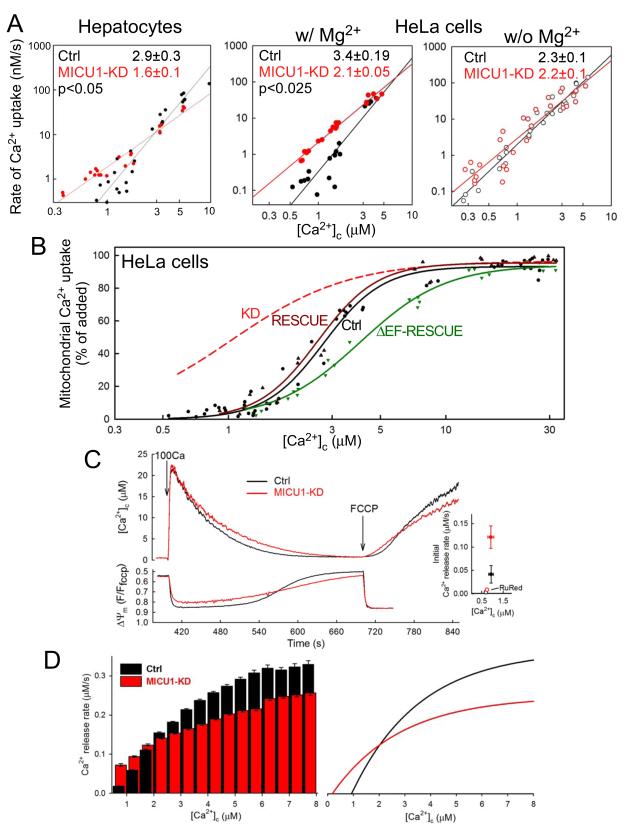
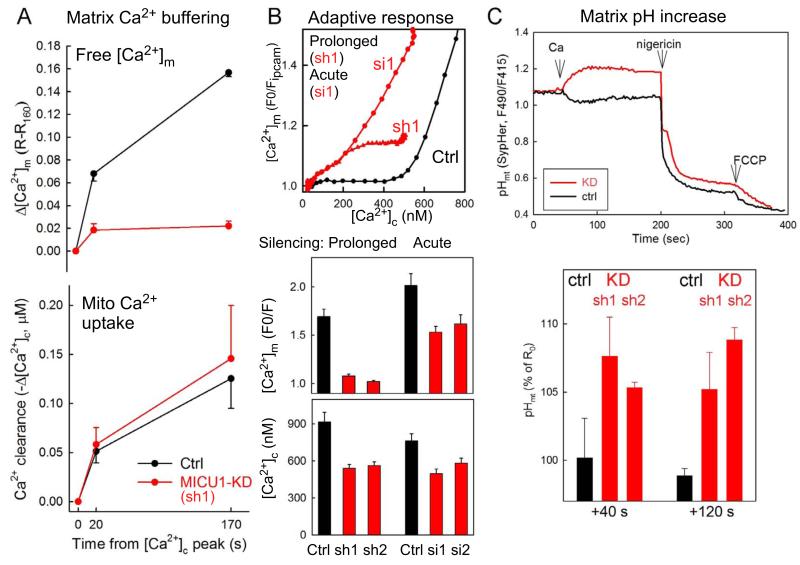
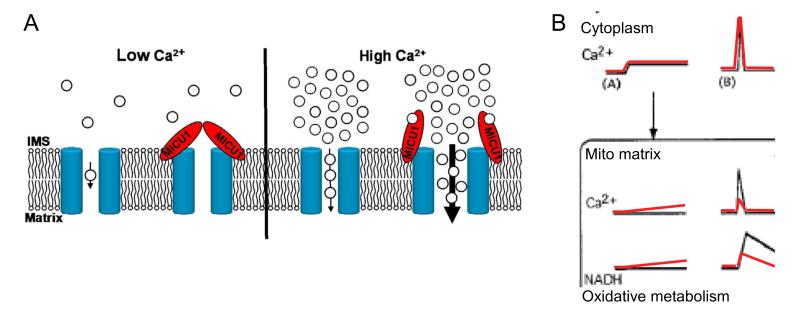
Mitochondrial Ca(2+) uptake via the uniporter is central to cell metabolism, signaling, and survival. Recent studies identified MCU as the uniporter's likely pore and MICU1, an EF-hand protein, as its critical regulator. How this complex decodes dynamic cytoplasmic [Ca(2+)] ([Ca(2+)]c) signals, to tune out small [Ca(2+)]c increases yet permit pulse transmission, remains unknown. We report that loss of MICU1 in mouse liver and cultured cells causes mitochondrial Ca(2+) accumulation during small [Ca(2+)]c elevations but an attenuated response to agonist-induced [Ca(2+)]c pulses. The latter reflects loss of positive cooperativity, likely via the EF-hands. MICU1 faces the intermembrane space and responds to [Ca(2+)]c changes. Prolonged MICU1 loss leads to an adaptive increase in matrix Ca(2+) binding, yet cells show impaired oxidative metabolism and sensitization to Ca(2+) overload. Collectively, the data indicate that MICU1 senses the [Ca(2+)]c to establish the uniporter's threshold and gain, thereby allowing mitochondria to properly decode different inputs.


Figures

Fig1
Fig1. Ca2+ handling in MICU1-KD hepatocytes and HeLa cells
(A) Phenylephrine (Phe, 20 μM)-induced [Ca2+]m signals in control (Ctrl), MICU1-KD and MCU-KD mouse hepatocytes. Left: fluorescence images of mitochondria-targeted ratiometric pericam (mtrpcam) obtained with excitation at the pH-insensitive excitation wavelength (415nm) overlaid with a green difference image depicting changes during Phe stimulation. Right: corresponding [Ca2+]m time courses. Rpcam fluorescence is inversely normalized to the baseline (F0/F). (B) Mean [Ca2+]c and [Ca2+]m signals obtained by simultaneous recording of rhod2 and mtrpcam fluorescence (n=43-57 cells, upper) and [Ca2+]c signals recorded separately using fura2 (n=71-121, lower). (C) Fluorescence of mtrpcam in resting and Phestimulated Ctrl, MICU1-KD and MCU-KD primary hepatocytes (n=50-62 from 3 different mice). Fluorescence values are shown in arbitrary units, inverted but without normalization to allow comparison of the resting [Ca2+]m. (D) Resting and agonist-stimulated JO2 in Ctrl and MICU1-KD hepatocytes (n=4). (E) SOCE-associated [Ca2+]c (fura2) and [Ca2+]m (mtrpcam) signals monitored separately in Ctrl, MICU1-KD and MCU-KD hepatocytes pretreated with Tg in a Ca2+-free ECM. To evoke SOCE 1 mM CaCl2 (Ca) was added. Left: mean time courses. Right: [Ca2+]m vs. [Ca2+]c (n=144-172 cells for each). (F) [Ca2+]m responses to SOCE in Ctrl, MICU1-KD and RESCUED stable HeLa cells. The mean traces (upper) and mean peak values (lower) of the single cell recordings are shown. (n=16-52 for each). (G) [Ca2+]m vs. [Ca2+]c curves of individual Ctrl (top) and MICU1-KD cells (bottom) from similar experiments as in (F). (H) Mean peak [Ca2+]c (fura2) and [Ca2+]m (mtipcam) levels recorded during SOCE induced by addition of 0.2mM CaCl2 in stable MICU1-KD and Ctrl HeLa cells (n=16-21). (I) Measurement of the JO2 response during SOCE (n = 4 plates/genotype, 3-4 wells/condition/plate). (J-L) [Ca2+]c rise caused by FCCP after (J) and before SOCE (K).
Fig2
Fig2. MICU1 controls the threshold of mitochondrial Ca2+ uptake
(A) Clearance of Ca2+ added to the cytoplasmic buffer in suspensions of permeabilized HeLa cells incubated in the presence of Tg (2 μM). Left: time courses of [Ca2+]c upon addition of 100 μM (100Ca, upper) or 2 μM (2Ca, lower) CaCl2 to Ctrl (black) and MICU1-KD (red) cells in the absence and presence of RuRed (3 μM). Right: mitochondrial Ca2+ uptake as the percent recovery of the initial [Ca2+]c rise 30s and 180s after Ca2+ addition (means+S.E., n=11). (B) Mitochondrial clearance of [Ca2+]c elevations evoked by 2μM added CaCl2 in permeabilized Ctrl and MICU1-KD hepatocytes. (C) Mitochondrial maintenance of basal steady-state [Ca2+]c in suspensions of permeabilized Ctrl (left) and MICU1-KD (right) HeLa cells as determined by inhibitors of mitochondrial Ca2+ uptake (RuRed, pink) and Na+-dependent extrusion (CGP37157 20 μM, green). (D) [Ca2+]c dose-response of the mitochondrial Ca2+ uptake in HeLa cells (left) and hepatocytes (right), determined as in Fig2A. The CaCl2 doses added were (in μM) 1, 2, 5, 10, 100 (n=4-9). For the hepatocytes, a sigmoid curve fitted to each data set is shown.
Fig3
Fig3. MICU1 contributes to cooperative activation of mtCU
(A) Double logarithmic plots of initial Ca2+ uptake rates vs. [Ca2+]c in Ctrl and MICU1-KD hepatocytes (left) and stable HeLa cells in the presence (middle) and absence of Mg2+ (right). Slope of linear fit for each data set is shown (n=3). (B) [Ca2+]c dose-responses of the fractional mitochondrial Ca2+ uptake in Ctrl, RESCUE and ΔEF-RESCUE HeLa cells. Data points from individual recordings (≥3 for each Ca2+ dose) and a sigmoid (logistic) fit to each data set are shown. The sigmoid fit for MICU1-KD cells from Fig2D is shown as a reference (red). (C) [Ca2+]c (top) and ΔΨm (bottom) time courses showing the mitochondrial clearance of a 100 μM CaCl2 pulse (100Ca) and subsequent FCCP-induced Ca2+ release in suspensions of permeabilized HeLa cells. Inset: mean initial Ca2+ release ([Ca2+]c rise) rates from recordings where by the time of FCCP addition [Ca2+]c dropped below 1.2 μM (Means±S.E., n=3). Rates obtained from recordings in the presence of RuRed (3 μM) added 30 s before FCCP are shown with open symbol. (D) Left: Instantaneous rate of FCCP-induced Ca2+ efflux at each [Ca2+]c (0.5μM binning) obtained via differentiation of the initial period of the [Ca2+]c rises (n=7). Right: Instantaneous Ca2+ release rates extrapolated from compilation of differentiated sigmoidal (logistic) fits. Predicted 0 crossings (the effective thresholds) are 937 and 185 nM for Ctrl and MICU1-KD, respectively.
Fig4
Fig4. MICU1 faces the outer surface of the IMM to sense [Ca2+]c
(A) Representative [Ca2+]c time courses of the mitochondrial clearance of a 100 μM CaCl2 pulse and the subsequent FCCP-induced Ca2+ release (as in Fig3C). FCCP is added at different time points during the [Ca2+]c recovery phase. Linear fits are laid over the fast phase of Ca2+ release (purple dashed lines) to underscore the differences in the initial kinetics. In the inset the two FCCP additions are time-synchronized to further emphasize [Ca2+]c dependence, (90s time-period is shown). (B) 150s after addition of a 10 μM CaCl2 pulse, either 0 (black) or 10 μM (blue) EGTA was added to establish different [Ca2+]c. Without EGTA addition, FCCP fully released the mitochondria-accumulated Ca2+ in 2 minutes (no further [Ca2+]c increase upon addition of Ca2+ ionophore ionomycin). Lowering [Ca2+]c to 0.1 μM by EGTA abolished the [Ca2+]c increase caused by FCCP but subsequent ionomycin addition caused substantial [Ca2+]c increase, indicating the continued accumulation of Ca2+ in the mitochondria. (C-D) Topology of MICU1 was investigated using isolated HEK-293T cell mitochondria. (C) Analysis of supernatant (S) and insoluble pellet (P) fractions following carbonate extraction at pH 10 and pH 11.5 with immunoblotting against MICU1 and the established integral membrane proteins TIMM23 and MCU, the soluble protein CYCS, and the peripheral membrane protein ATP5a. (D) Mitochondria were treated with PK with increasing concentrations of detergent. Proteins with known localization are immunoblotted and labeled according to their topology. Bands representing cleavage products are shown for OXA1L and HSP60 (with Triton).
Fig5
Fig5. Enhanced mitochondrial matrix Ca2+ chelation as an adaptive response to MICU1 depletion
(A) Mitochondrial Ca2+ uptake (lower) and the corresponding increase in [Ca2+]m (upper) were monitored simultaneously in permeabilized HeLa cells in the presence of Tg. To obtain comparable Ca2+ uptake, 5μM and 2μM CaCl2 were added to Ctrl and stable MICU1-KD cells, respectively (n=4). (B) Top: [Ca2+]m vs. [Ca2+]c relationships during SOCE in acute (48hr, si1) and stable MICU1-KD (sh1,2) cells. Middle and lower graphs show the peak [Ca2+]m and [Ca2+]c increases evoked by SOCE (1mM CaCl2) (n=24-62). (C) Mitochondrial matrix alkalinization in stable MICU1-KD (sh1 & sh2) cells during SOCE (1mM CaCl2) recorded by mtSypHer. Ionophore (Nigericin, 5μM) and FCCP (5μM) were added to induce matrix acidification. Representative traces (upper) and mean normalized post-SOCE (40 and 120 s) values (lower n=3-4, p<0.05).
Fig6
Fig6. MICU1 supports decoding of [Ca2+]c signals by stabilizing the closed state and supporting Ca2+-dependent activation of mtCU
(A) Graphical representation of the modulation of mtCU by MICU1. (B) The model depicts the two major flaws in mitochondrial [Ca2+]c signal detection and the coupled Ca2+ control of oxidative metabolism in MICU1 deficient cells. Small [Ca2+]c elevations (A) are tuned out by Ctrl (black) mitochondria owing to MICU1-dependent thresholding; but are able to propagate to the MICU1-deficient (red) mitochondria causing stimulation and long-term exhaustion of oxidative metabolism. Large [Ca2+]c transients (B) such as the rapid short-lasting IP3R-derived high [Ca2+]c microdomains are effectively transferred to the mitochondrial matrix due to MICU1-dependent cooperative activation of mtCU. In the absence of MICU1 the efficacy of signal propagation decreases. Please note that oxidative metabolism was assessed by NAD(P)H imaging in (Hajnoczky et al., 1995) and by cellular JO2 measurement in the present study.

References

    1. Baughman JM, Perocchi F, Girgis HS, Plovanich M, Belcher-Timme CA, Sancak Y, Bao XR, Strittmatter L, Goldberger O, Bogorad RL, Koteliansky V, Mootha VK. Integrative genomics identifies MCU as an essential component of the mitochondrial calcium uniporter. Nature. 2011 - PMC - PubMed
    1. Belousov VV, Fradkov AF, Lukyanov KA, Staroverov DB, Shakhbazov KS, Terskikh AV, Lukyanov S. Genetically encoded fluorescent indicator for intracellular hydrogen peroxide. Nature methods. 2006;3:281–286. - PubMed
    1. Beutner G, Sharma VK, Lin L, Ryu SY, Dirksen RT, Sheu SS. Type 1 ryanodine receptor in cardiac mitochondria: Transducer of excitation-metabolism coupling. Biochimica et biophysica acta. 2005 - PubMed
    1. Bick AG, Calvo SE, Mootha VK. Evolutionary diversity of the mitochondrial calcium uniporter. Science. 2012;336:886. - PMC - PubMed
    1. Bragadin M, Pozzan T, Azzone GF. Kinetics of Ca2+ carrier in rat liver mitochondria. Biochemistry. 1979;18:5972–5978. - PubMed

Publication types

MeSH terms

Substances