

doi: 10.1016/j.cmet.2013.04.019.
The mitochondrial chaperone TRAP1 promotes neoplastic growth by inhibiting succinate dehydrogenase
Affiliations
- PMID: 23747254
- PMCID: PMC3677096
- DOI: 10.1016/j.cmet.2013.04.019
Item in Clipboard
The mitochondrial chaperone TRAP1 promotes neoplastic growth by inhibiting succinate dehydrogenase
Cell Metab.
.
Abstract
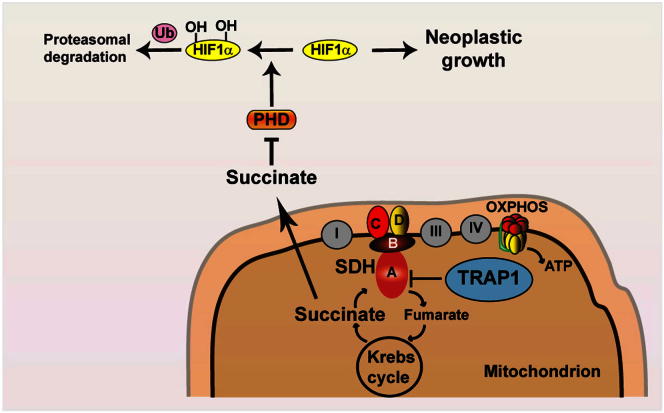
We report that the mitochondrial chaperone TRAP1, which is induced in most tumor types, is required for neoplastic growth and confers transforming potential to noncancerous cells. TRAP1 binds to and inhibits succinate dehydrogenase (SDH), the complex II of the respiratory chain. The respiratory downregulation elicited by TRAP1 interaction with SDH promotes tumorigenesis by priming the succinate-dependent stabilization of the proneoplastic transcription factor HIF1α independently of hypoxic conditions. These findings provide a mechanistic clue to explain the switch to aerobic glycolysis of tumors and identify TRAP1 as a promising antineoplastic target.
Copyright © 2013 Elsevier Inc. All rights reserved.
Figures
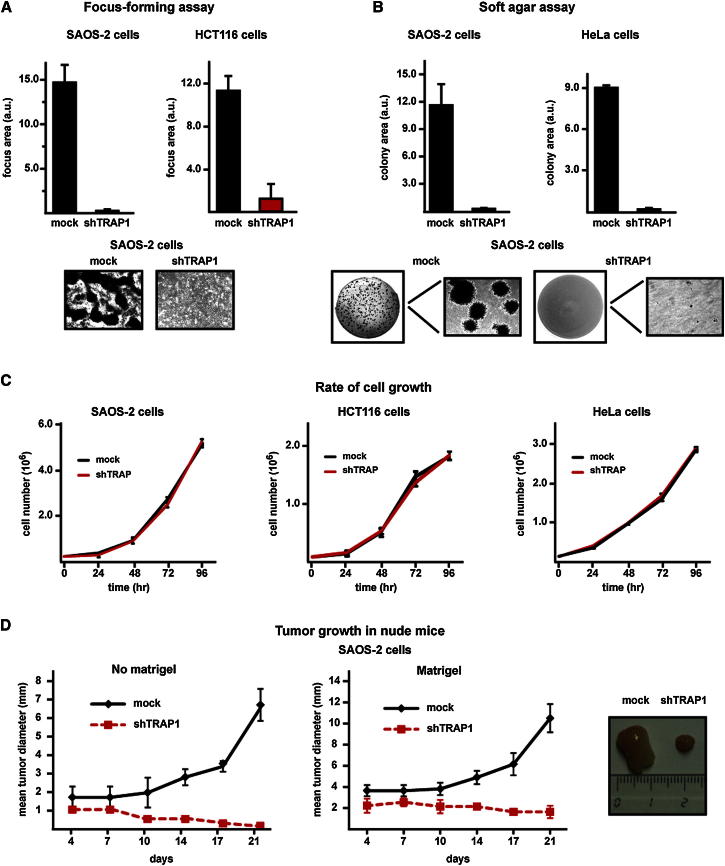
TRAP1 Knockdown Inhibits In Vitro and In Vivo Neoplastic Transformation (A and B) Human osteosarcoma SAOS-2 cells, human colorectal carcinoma HCT116 cells, and human cervix carcinoma HeLa cells lose the capability to form foci (A) or colonies in soft agar (B) after knocking down TRAP1 expression. Cells stably transfected with a scrambled shRNA or with TRAP1 shRNAs are dubbed mock and shTRAP1, respectively. Data indicate the total focus or colony area at the 25th experimental day. Representative areas showing focus or colony growth are reported. (C) Rate of growth of mock and shTRAP1 SAOS-2, HCT116, and HeLa cells. (D) Kinetics of tumor growth in nude mice after injection of SAOS-2 cells without or with a Matrigel bolus (left and right, respectively); representative tumors grown with Matrigel are shown on the right. Data are reported as mean ± SD values (n ≥ 3).
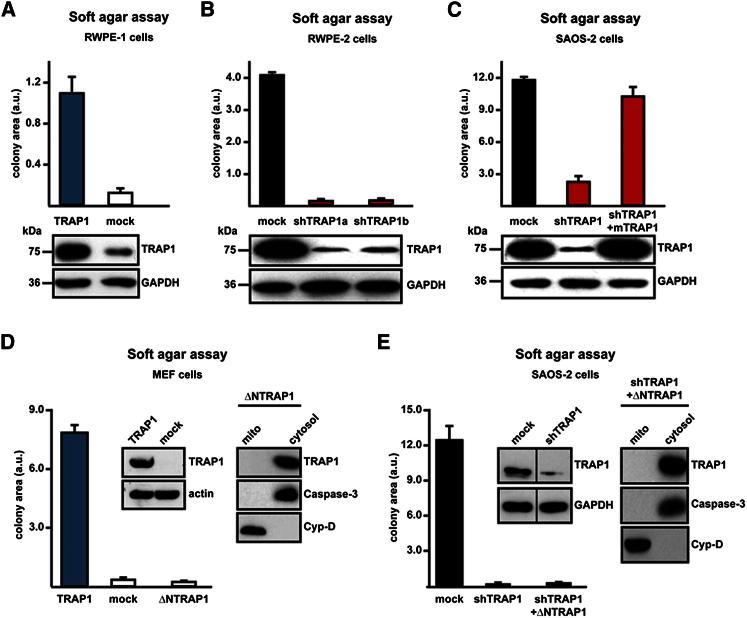
Mitochondrial TRAP1 Confers Transforming Potential to Cells (A and B) Soft agar tumorigenesis assays were performed both in nontransformed cells (i.e., human epithelial prostate RWPE-1 cells) (A) and MEFs (D), stably transfected with either a TRAP1 cDNA or with a scrambled shRNA (mock); and in transformed cells, i.e., human epithelial prostate RWPE-2 cells obtained by v-Ki-Ras expression in RWPE-1 cells (B); cells dubbed shTRAP1a and shTRAP1b were transfected with different TRAP1 shRNAs. (C) Expression of a mouse TRAP1 cDNA (mTRAP1) insensitive to human-directed shTRAP1 constructs reinstated the capability to form foci in human osteosarcoma SAOS-2 cells stably transfected with TRAP1 shRNAs (shTRAP1). (D and E) Growth of colonies in soft agar was also assessed in MEF cells (D) or in SAOS-2 shTRAP1 cells (E) stably transfected with a TRAP1 construct lacking the mitochondrial import sequence (ΔNTRAP1). Western immunoblots show TRAP1 expression levels in the different cell types; GAPDH or actin are shown as loading controls. In (D) and (E), the cytosolic localization of ΔNTRAP1 was assessed by subcellular fractionation; caspase-3 and cyclophilin D (CyP-D) are used to verify purity of cytosolic and mitochondrial fractions, respectively. Data are reported as mean ± SD values (n ≥ 3).
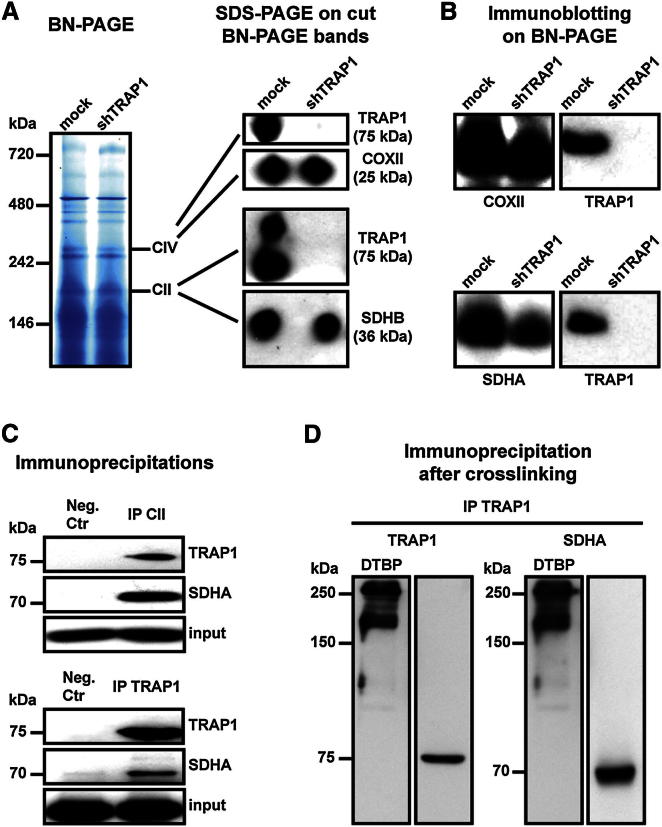
TRAP1 Binds to ETC Complexes IV and II (A) Blue native gel electrophoresis. Bands corresponding to complex IV (cytochrome oxidase, COX) and complex II (succinate dehydrogenase, SDH) were cut, run on a SDS-PAGE, and probed with anti-TRAP1, anti-COX subunit II (COXII), and anti-SDH subunit B (SDHB) antibodies. (B) Western immunoblotting was performed directly on a BN-PAGE. Probing was carried out with an anti-TRAP1 antibody and, in parallel lanes, with either an anti-COXII or an anti-SDH subunit A (SDHA) antibody. Note the smeared signal of both COXII and SDHA, suggesting that a population of complexes II and IV is present in the BN-PAGE; TRAP-1 is in the upper part of each complex band. (C) Complex II and TRAP1 immunoprecipitations (IPs) on lysates of SAOS-2 mock cells. The interaction between TRAP1 and SDHA is shown by coIP. Immunoglobulin G (IgG) is used in negative isotype controls. (D) Crosslinking experiments on mitochondria from mock SAOS-2 cells. TRAP1 was immunoprecipitated after mitochondrial treatment with the crosslinker DTBP, loaded in parallel on separate lanes of an SDS-PAGE, and probed with either an anti-TRAP1 or an anti-SDHA antibody.
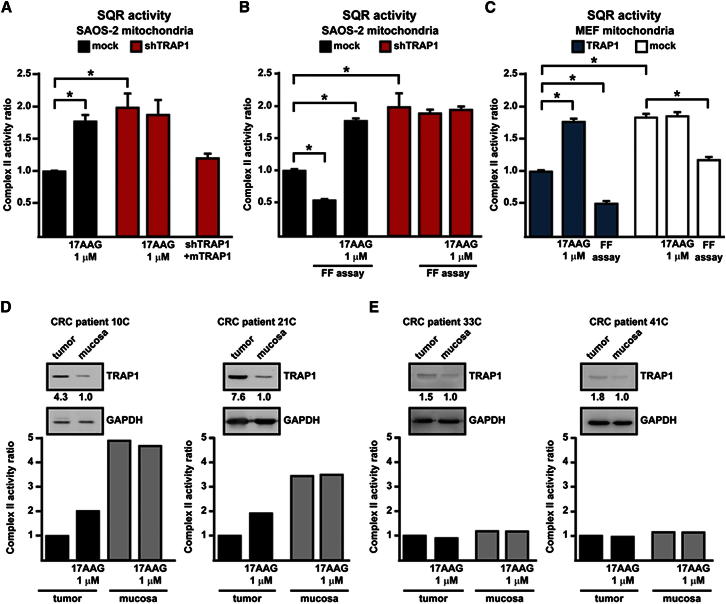
TRAP1 Downregulates the Enzymatic Activity of RC Complex II (A and B) Analysis of the SQR enzymatic activity of complex II in mitochondria from SAOS-2 cells. In (A), analysis is performed on mitochondria from cultured cells; in (B), complex II activity values of mitochondria from cultured cells are compared with mitochondrial extracts from focus-forming assays obtained at the 15th experimental day (i.e., 1–2 days before cells that did not form foci massively underwent death). Mock indicates SAOS-2 cells stably transfected with a scrambled shRNA; shTRAP1 indicates SAOS-2 cells stably transfected with a TRAP1 shRNA; shTRAP1 + mTRAP1 indicates SAOS-2 shTRAP1 cells transfected with a mouse TRAP1 cDNA insensitive to human-directed shTRAP1 constructs (see Figure 2C). Enzyme activity values are compared to those of SAOS-2 mock cells in culture. (C) SQR activity is measured on mitochondria from MEFs kept in culture or undergoing a focus-forming assay (15th day). TRAP1 indicates cells stably transfected with the TRAP1-containing vector; cells stably transfected with a control vector are dubbed mock. Enzyme activity values are compared to those of mitochondria from TRAP1-expressing MEFs in culture. TRAP1 inhibitor 17-AAG was added 5 min before starting recordings. Bar graphs report mean ± SD values (n ≥ 3); *p < 0.01 with a Student’s t test analysis. (D and E) Representative analyses of SQR activity on human colorectal cancer (CRC) samples are compared to surrounding noncancerous mucosae of the same patient. As shown in the insets, TRAP1 expression was compared between each CRC and noncancerous mucosa by western immunoblot followed by densitometric analysis normalized to GAPDH, which was used as a loading control. TRAP1 was considered induced when the ratio of the protein level between tumor sample and surrounding noncancerous mucosa was ≥ 3. Samples reported in (D) were obtained from metastatic CRC tumors and display an increase of TRAP1 expression in tumors with respect to mucosae; samples reported in (E) were obtained from nonmetastatic CRC tumors and do not show any relevant increase of TRAP1 expression.
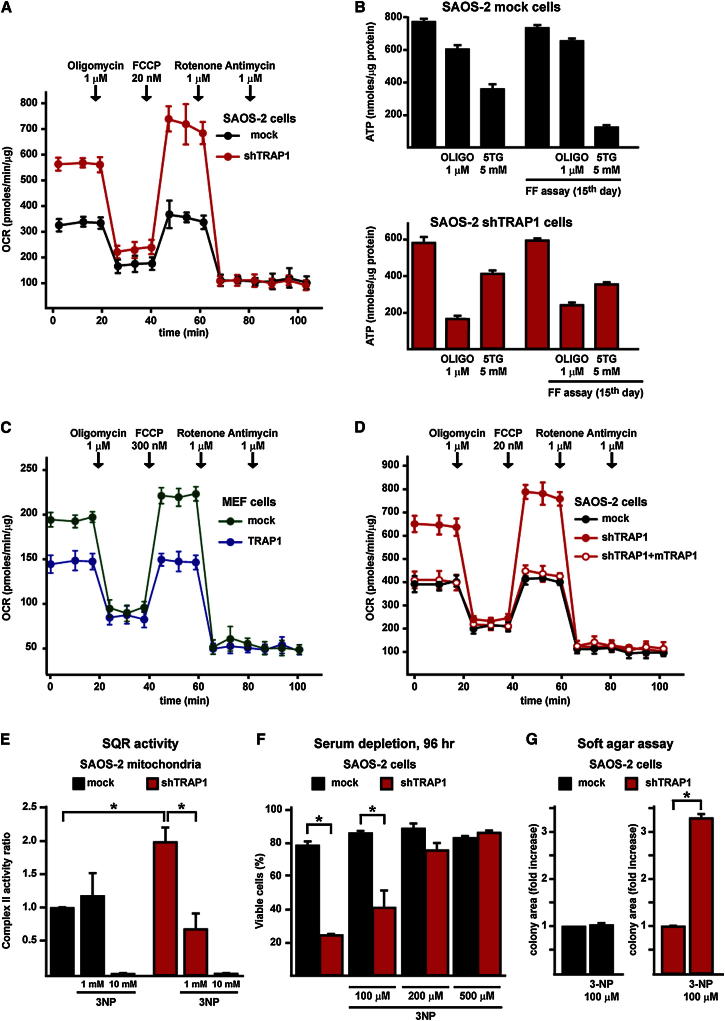
TRAP1-Induced Downmodulation of SDH Activity Decreases Cell Oxygen Consumption Rate and OXPHOS-Dependent Synthesis of ATP and Prompts Resistance to Stress Stimuli (A) Representative traces of OCR experiments performed on monolayers of living SAOS-2 cells. Subsequent additions of the ATP synthase inhibitor oligomycin, the uncoupler FCCP, the ETC complex I inhibitor rotenone, and the ETC complex III inhibitor antimycin A were carried out. (B) ATP levels were measured in mock or shTRAP1 SAOS-2 cells kept in standard culture conditions (bars on the left) or in a focus-forming assay for 15 days (i.e., 1–2 days before cells that did not form foci massively underwent death (bars on the right). Where indicated, cells were treated for 2 hr with the ATP synthase inhibitor oligomycin or the hexokinase inhibitor 5-thioglucose (5TG) in a no-glucose medium to discriminate between ATP produced by OXPHOS and by glycolysis. (C and D) Representative traces of OCR experiments performed on monolayers of living MEF cells (C) or SAOS-2 cells (D). Experiments were carried out as in (A). (E) Analysis of the effect of the SDH inhibitor 3-NP on the SQR enzymatic activity of complex II in mitochondria from SAOS-2 cells. 3-NP was added 5 min before starting recordings; 10 mM 3-NP was used to fully inhibit the SDH enzyme. (F) Cytofluorimetric cell death analysis of SAOS-2 cells starved in a medium without serum for 96 hr with or without the reported concentrations of 3-NP. Viable cells are identified as double negative for propidium iodide and Annexin V-FITC. (G) Soft agar assay on SAOS-2 cells. Data are reported as fold increase of colony area of mock cells grown with 3-NP compared with mock cells kept without the drug (left) and, separately, as fold increase of colony area of shTRAP1 cells grown with 3-NP compared with shTRAP1 cells kept without the drug (right). In SAOS-2 experiments, mock indicates cells stably transfected with a scrambled shRNA; shTRAP1 indicates cells stably transfected with a TRAP1 shRNA; shTRAP1 + mTRAP1 indicates cells stably transfected with a TRAP1 shRNA and expressing a mouse TRAP1 cDNA. In the experiment with MEFs, cells were stably transfected with either a TRAP1 cDNA or a scrambled shRNA (mock). All bar graphs report mean ± SD values (n ≥ 3); *p < 0.01 with a Student’s t test analysis.
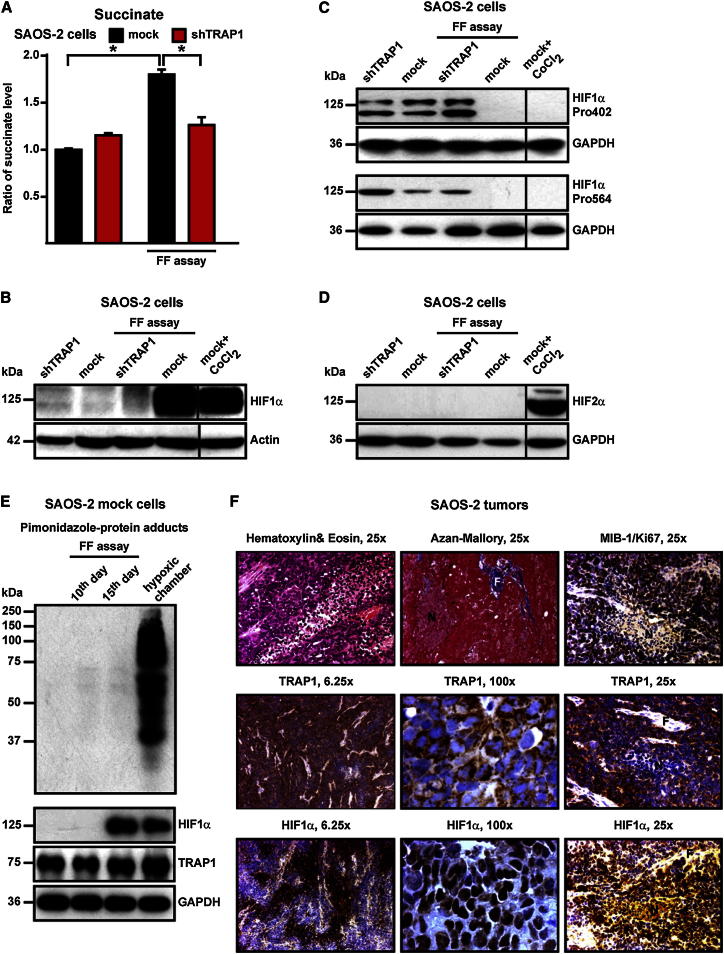
TRAP1 Increases Intracellular Succinate Concentration and Stabilizes HIF1α in a Hypoxia-Independent Way (A) Bar graphs showing liquid chromatography-mass spectrometry (LC-MS) measurements of intracellular succinate level. Values are compared with cultured mock SAOS-2 cells. (B–D) Western immunoblots showing HIF1α expression (B), HIF1α hydroxylation of the Pro402 and Pro564 residues (C), and HIF2α expression in cultured cells and on extracts from focus-forming assays obtained at the 15th experimental day (i.e., 1–2 days before cells that did not form foci massively underwent death). CoCl2 is used as a positive control for HIF1α and HIF2α stabilization. Blots were probed with an anti-actin (B) or an anti-GAPDH (C and D) antibody to check for protein load. (E) Detection of pimonidazole-protein adducts in SAOS-2 mock cells kept in either normal culture or focus-forming conditions for 10 or 15 days. Pimonidazole (200 μM) was added on the focus-forming plate 2 hr before lysis. As a positive control, cells were kept for 24 hr in a hypoxic chamber (0.5% O2). On the same samples, both HIF1α stabilization and the expression level of TRAP1 were evaluated; blots were probed with an anti-GAPDH to check for protein load. (F) Immunohistochemical inspections of tumors formed by SAOS-2 control cells after injection in nude mice (see Figure 1F). Hematoxylin and eosin (H&E) and Azan-Mallory staining reveal tumors rich in densely packed cells, with few fibrotic areas (F) and a large number of necrotic regions (N). TRAP1 is visible in most cells (see the 6.25× magnification) as a punctate signal (100× magnification), which is compatible with its mitochondrial localization. HIF1α expression is evident all along the samples (see the 6.25× magnification), mainly in the nuclear compartment of cells (100× magnification), and the signal is particularly strong in the perinecrotic areas, where the proliferation marker MIB-1/Ki67 is also found (25× magnification).
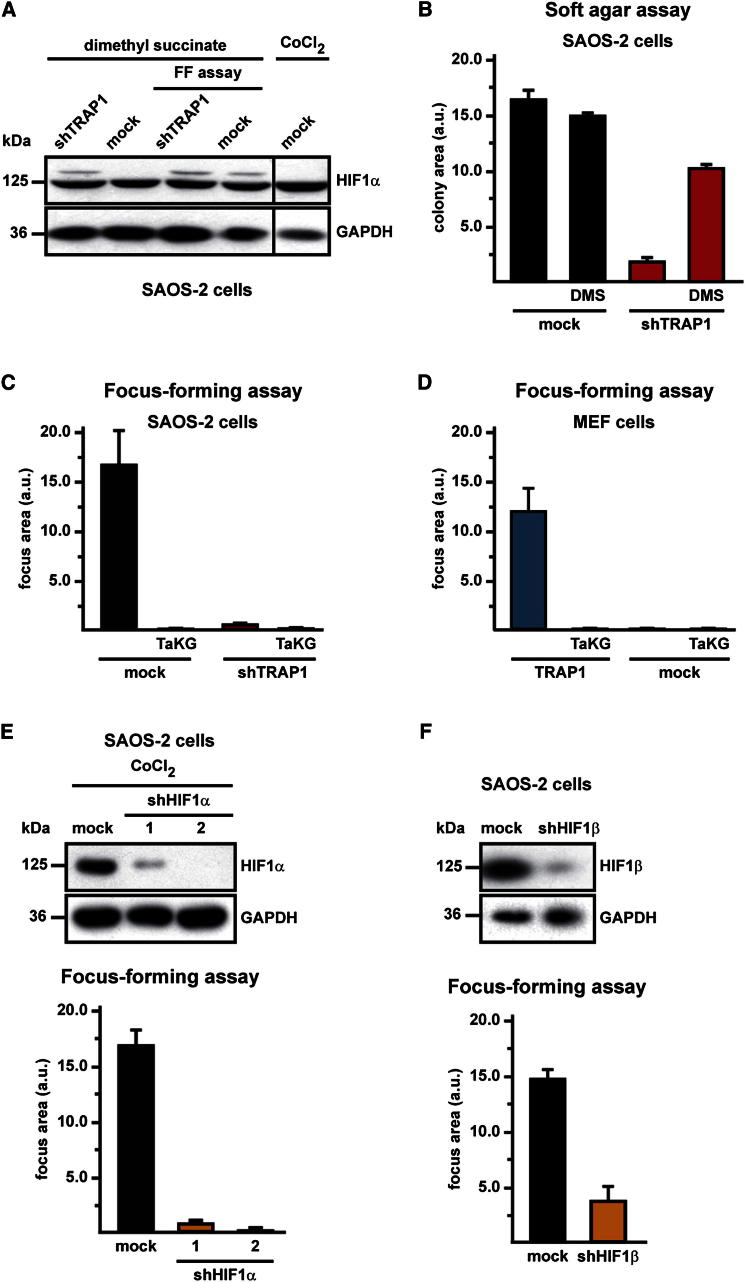
TRAP1 Favors Tumor Growth through Succinate-Dependent Stabilization of HIF1α (A) Western immunoblot showing HIF1a stabilization in SAOS-2 cells kept either in culture or in focus-forming conditions in the presence of the cell-permeable succinate analog dimethyl succinate (20 mM, 48 hr). Extracts from focus-forming assays were obtained at the 15th experimental day (i.e., 1–2 days before cells that did not form foci massively underwent death). Blots were probed with an anti-GAPDH to check for protein load. Cells are dubbed as in previous figures with respect to TRAP1 expression. (B) Soft agar experiments performed on SAOS-2 cells treated with dimethyl succinate (5 mM). Data indicate the total colony area at the 25th experimental day. (C–F) Focus-forming assays on SAOS-2 cells (C) or MEFs (D) grown with or without TaKG and on SAOS-2 cells in which HIF1α (E) or HIF1β (F) expression had been knocked down by RNAi. Data are reported as in Figure 1A. In (E), CoCl2 treatment is used to maximize HIF1α expression. In (F), knocking down of HIF1β is obtained with a mixture of three different shRNAs. Bar graphs report mean ± SD values (n ≥ 3); *p < 0.01 with a Student’s t test analysis. Cells are dubbed as in previous figures.
References
-
- Abu-Amero K.K., Alzahrani A.S., Zou M., Shi Y. High frequency of somatic mitochondrial DNA mutations in human thyroid carcinomas and complex I respiratory defect in thyroid cancer cell lines. Oncogene. 2005;24:1455–1460. - PubMed
-
- Arteel G.E., Thurman R.G., Raleigh J.A. Reductive metabolism of the hypoxia marker pimonidazole is regulated by oxygen tension independent of the pyridine nucleotide redox state. Eur. J. Biochem. 1998;253:743–750. - PubMed
-
- Bardella C., Pollard P.J., Tomlinson I. SDH mutations in cancer. Biochim. Biophys. Acta. 2011;1807:1432–1443. - PubMed
-
- Brahimi-Horn M.C., Bellot G., Pouysségur J. Hypoxia and energetic tumour metabolism. Curr. Opin. Genet. Dev. 2011;21:67–72. - PubMed
Publication types
MeSH terms
Substances
Grants and funding
LinkOut - more resources
Full Text Sources
Other Literature Sources
Molecular Biology Databases
Miscellaneous
