. 2013 Oct 15;22(20):4194-205.
doi: 10.1093/hmg/ddt267. Epub 2013 Jun 6.

Blood RNA profiling in a large cohort of multiple sclerosis patients and healthy controls

Blood RNA profiling in a large cohort of multiple sclerosis patients and healthy controls

Dorothee Nickles et al. Hum Mol Genet. .

Abstract

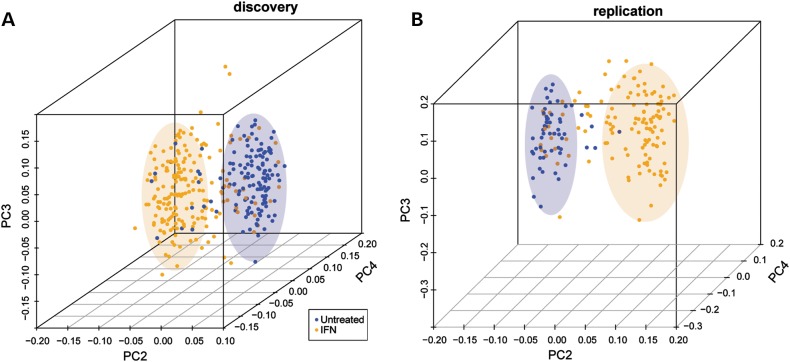
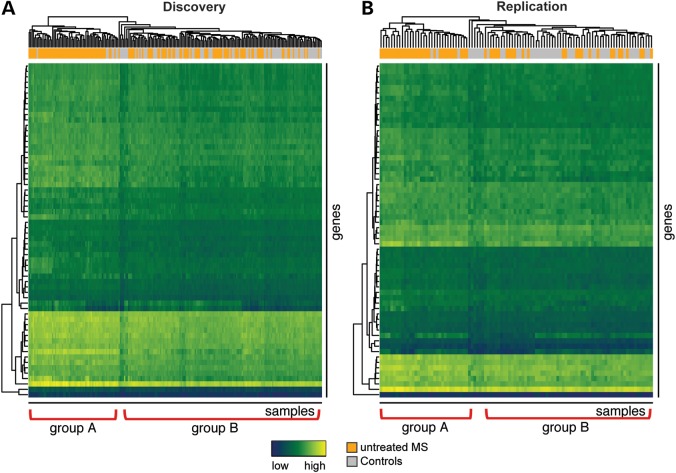
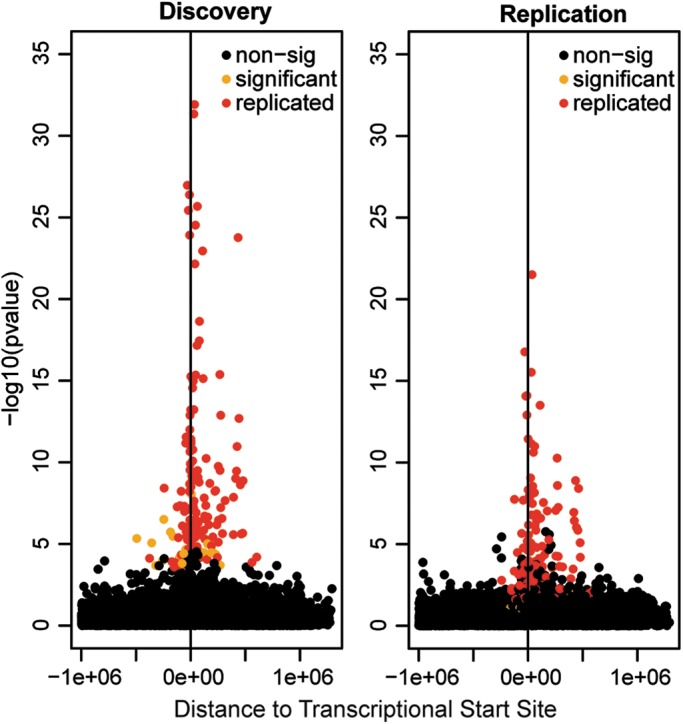
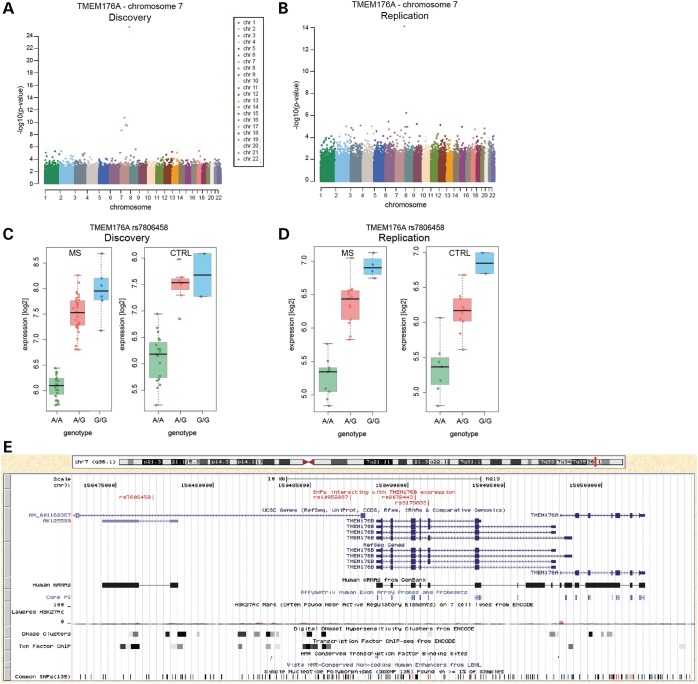
Multiple sclerosis (MS) is the most common autoimmune disease of the central nervous system (CNS). It is characterized by the infiltration of autoreactive immune cells into the CNS, which target the myelin sheath, leading to the loss of neuronal function. Although it is accepted that MS is a multifactorial disorder with both genetic and environmental factors influencing its development and course, the molecular pathogenesis of MS has not yet been fully elucidated. Here, we studied the longitudinal gene expression profiles of whole-blood RNA from a cohort of 195 MS patients and 66 healthy controls. We analyzed these transcriptomes at both the individual transcript and the biological pathway level. We found 62 transcripts to be significantly up-regulated in MS patients; the expression of 11 of these genes was counter-regulated by interferon treatment, suggesting partial restoration of a 'healthy' gene expression profile. Global pathway analyses linked the proteasome and Wnt signaling to MS disease processes. Since genotypes from a subset of individuals were available, we were able to identify expression quantitative trait loci (eQTL), a number of which involved two genes of the MS gene signature. However, all these eQTL were also present in healthy controls. This study highlights the challenge posed by analyzing transcripts from whole blood and how these can be mitigated by using large, well-characterized cohorts of patients with longitudinal follow-up and multi-modality measurements.


Figures

Figure 1.
Figure 1.
PCA of untreated and IFN-treated patients by the expression of IFN signature genes in the discovery (A) and replication (B) data sets. On the x-axis, principal component (PC) 2 is plotted, on the y-axis PC 3 and on the z-axis PC 4. IFN-treated patients are displayed in orange, untreated patients in blue. As indicated by the colored ellipses, these principal components split samples into two groups, corresponding to whether subjects were treated or not.
Figure 2.
Figure 2.
Unsupervised hierarchical clustering of MS patients and healthy controls according to the expression of MS signature genes in the discovery (A) and the replication (B) data sets. The rows are different genes, the columns reflect different experiments. The colored bar above the heatmap identifies patients (orange) and controls (grey). Two subgroups of MS patients, group A with a stronger signature and group B, emerge. Blue depicts low expression and yellow high expression. Hierarchical clustering was performed using Euclidean distance and average clustering.
Figure 3.
Figure 3.
Location of general cis-eQTL. Association P-values in discovery (A) and replication (B) data sets are plotted against the distance of each cis-SNP from the transcription start of studied transcripts. SNPs that were found to be significant in both discovery and replication data sets (replicated) are displayed in red, those with significant P-values only in the discovery data set (significant) are displayed in orange, all non-significant SNPs (non-sig) are shown in black.
Figure 4.
Figure 4.
Genetic make-up of MS gene cis-eQTL. (A and B) Manhattan plots of association P-values of all studied SNPs and the expression of one of the MS-associated genes with replicated cis-eQTL, TMEM176A, encoded on chromosome 7, in the discovery (A) and the replication (B) data sets. Each chromosome is displayed in a different color. Note the pronounced peak of association P-values on chromosome 7, on which TMEM176A is encoded, especially in the discovery data set. (C and D) Log2-transformed expression values for TMEM176A in dependence of the most significantly associated SNP, rs7806458 (genotype), in the discovery (C) and the replication (D) data sets in both MS patients (MS) and controls (CTRL). (E) University of California at Santa Cruz (UCSC) genome browser-based visualization of the genetic locus comprising TMEM176A, TMEM176B and the SNPs associated with their expression (shared: rs7806458, rs10952287, rs2072443; TMEM176B only: rs3173833), marked in red in the upper track. In addition to UCSC genes, RefSeqGenes and Human mRNA tracks, location of the probes on the analyzed microarray (‘Core PS’, Affy Exon Array) as well as the Encode Integrated Regulation tracks ‘Layered H3K27Ac’, ‘DNase Clusters’ and ‘Txn Factor ChIP’ are shown. Also, Vista Enhancers (‘HMR-Conserved Non-coding Human Enhancers’) and transcription factor binding sites (‘HMR Conserved Transcription Factor Binding Sites’, TFBS conserved) are displayed. Common SNPs (as of dbSNP v135) are shown in the bottom track.

References

    1. Rosati G. The prevalence of multiple sclerosis in the world: an update. Neurol. Sci. 2001;22:117–139. - PubMed
    1. Sospedra M., Martin R. Immunology of multiple sclerosis. Annu. Rev. Immunol. 2005;23:683–747. - PubMed
    1. Oksenberg J.R., Baranzini S.E. Multiple sclerosis genetics—is the glass half full, or half empty? Nat. Rev. Neurol. 2010;6:429–437. - PubMed
    1. Haines J.L., Ter-Minassian M., Bazyk A., Gusella J.F., Kim D.J., Terwedow H., Pericak-Vance M.A., Rimmler J.B., Haynes C.S., Roses A.D., et al. A complete genomic screen for multiple sclerosis underscores a role for the major histocompatability complex. The Multiple Sclerosis Genetics Group. Nat. Genet. 1996;13:469–471. - PubMed
    1. Nagasaka Y., Dillner K., Ebise H., Teramoto R., Nakagawa H., Lilius L., Axelman K., Forsell C., Ito A., Winblad B., et al. A unique gene expression signature discriminates familial Alzheimer's disease mutation carriers from their wild-type siblings. Proc. Natl Acad. Sci. USA. 2005;102:14854–14859. - PMC - PubMed

Publication types

MeSH terms

Associated data