. 2013 Aug;12(8):1106-19.
doi: 10.1128/EC.00093-13. Epub 2013 Jun 7.

Spatial reorganization of Saccharomyces cerevisiae enolase to alter carbon metabolism under hypoxia

Affiliations

Spatial reorganization of Saccharomyces cerevisiae enolase to alter carbon metabolism under hypoxia

Natsuko Miura et al. Eukaryot Cell. 2013 Aug.

Abstract

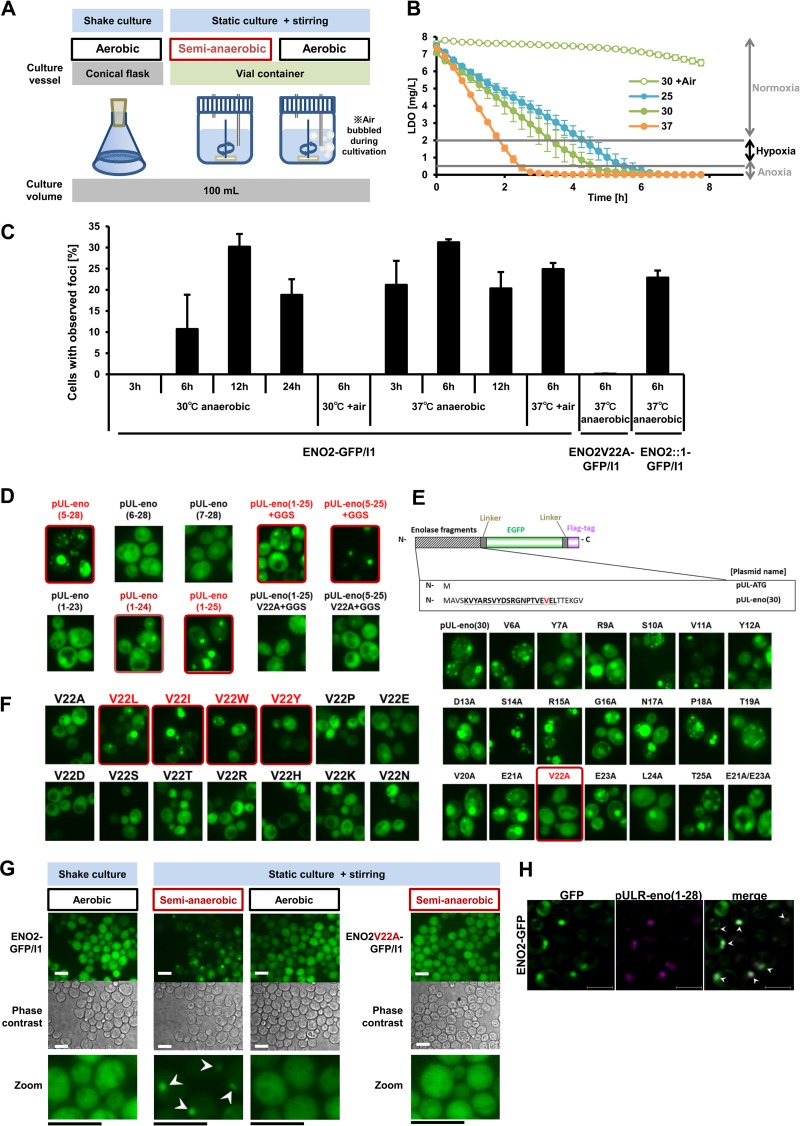
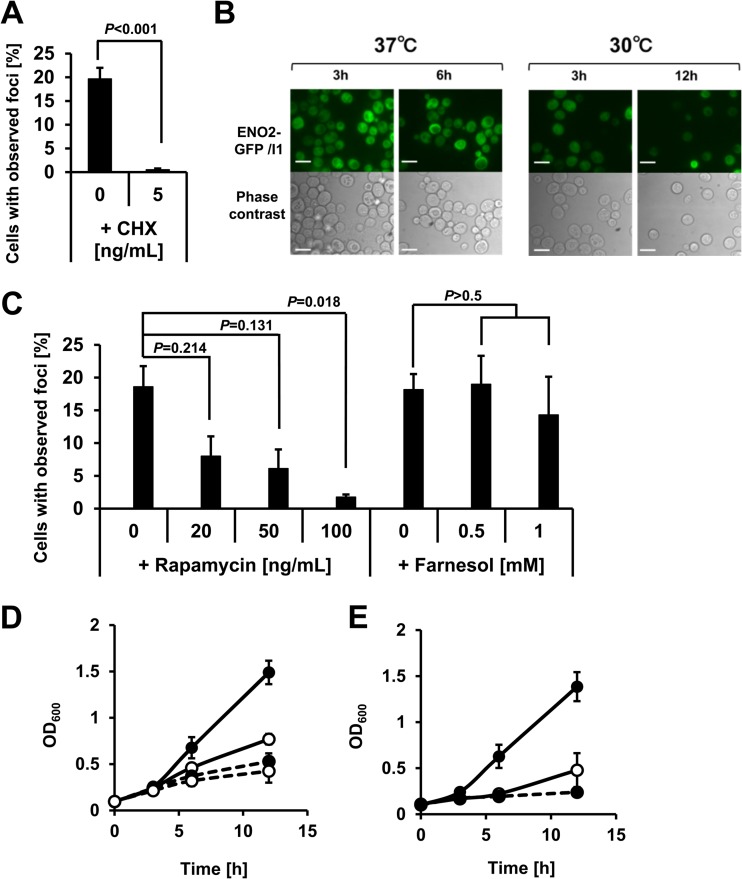
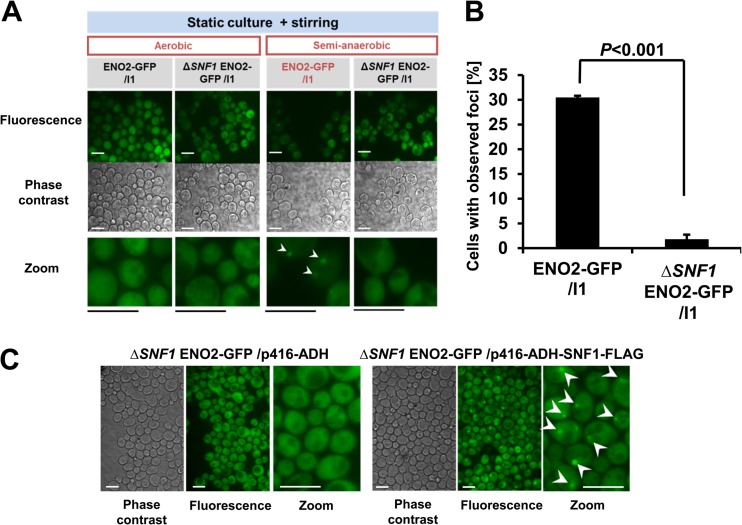
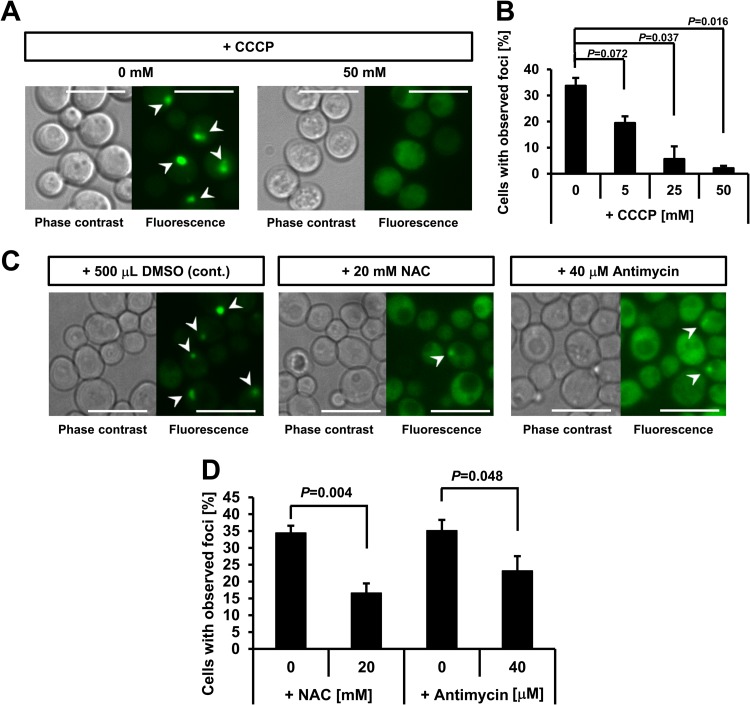
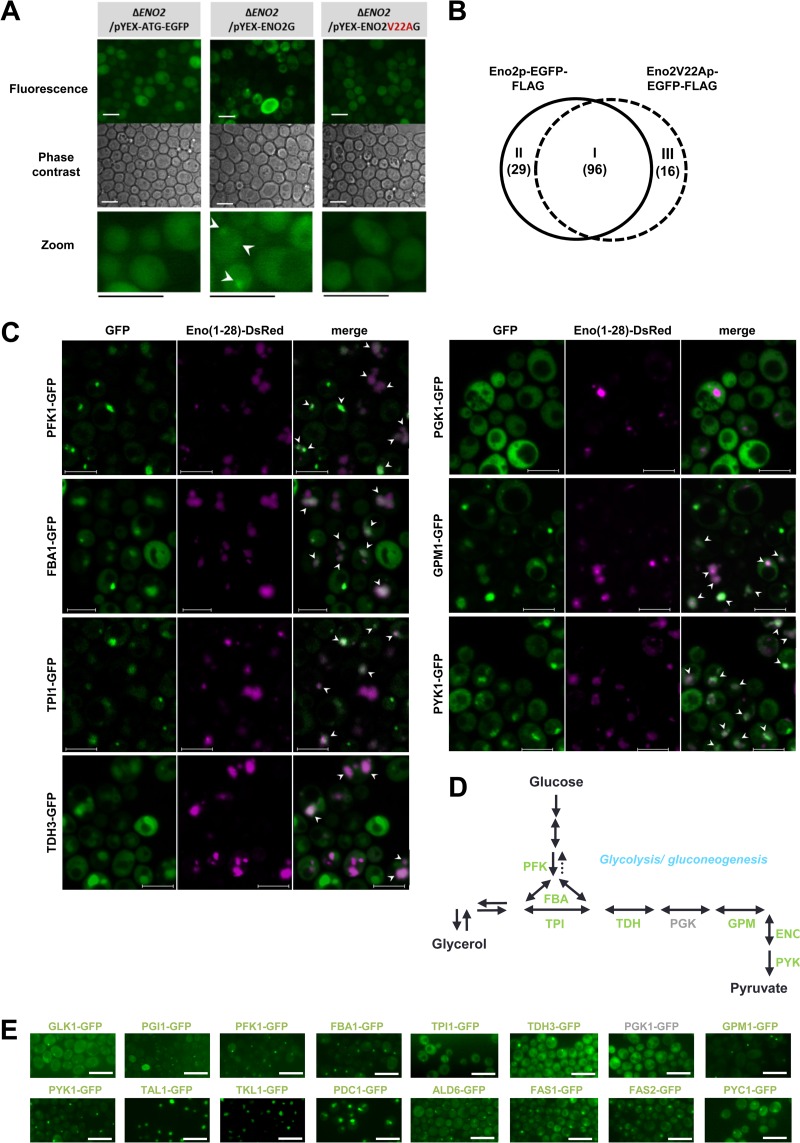
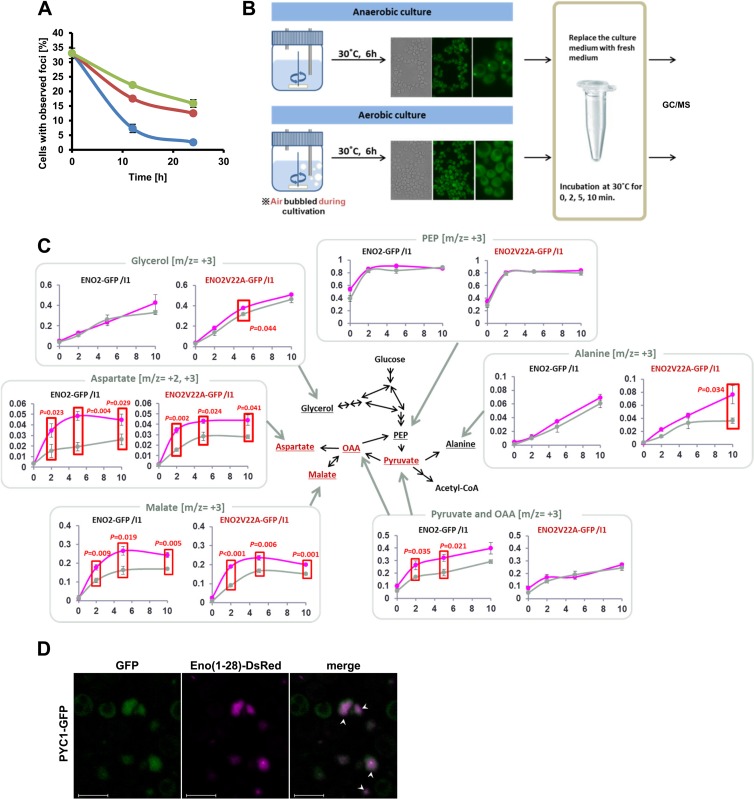
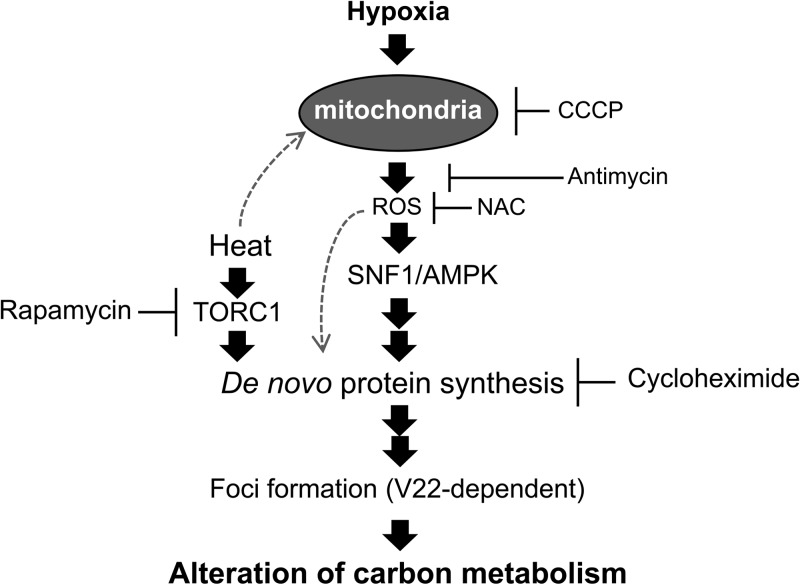
Hypoxia has critical effects on the physiology of organisms. In the yeast Saccharomyces cerevisiae, glycolytic enzymes, including enolase (Eno2p), formed cellular foci under hypoxia. Here, we investigated the regulation and biological functions of these foci. Focus formation by Eno2p was inhibited temperature independently by the addition of cycloheximide or rapamycin or by the single substitution of alanine for the Val22 residue. Using mitochondrial inhibitors and an antioxidant, mitochondrial reactive oxygen species (ROS) production was shown to participate in focus formation. Focus formation was also inhibited temperature dependently by an SNF1 knockout mutation. Interestingly, the foci were observed in the cell even after reoxygenation. The metabolic turnover analysis revealed that [U-(13)C]glucose conversion to pyruvate and oxaloacetate was accelerated in focus-forming cells. These results suggest that under hypoxia, S. cerevisiae cells sense mitochondrial ROS and, by the involvement of SNF1/AMPK, spatially reorganize metabolic enzymes in the cytosol via de novo protein synthesis, which subsequently increases carbon metabolism. The mechanism may be important for yeast cells under hypoxia, to quickly provide both energy and substrates for the biosynthesis of lipids and proteins independently of the tricarboxylic acid (TCA) cycle and also to fit changing environments.


Figures

Fig 1
Fig 1
Focus formation by the glycolytic enzyme enolase (Eno2p) under hypoxia (see also Fig. S1 in the supplemental material). (A) Illustration of fermentation vials for semianaerobic and anaerobic fermentative cultures. (B) Amount of luminescent dissolved oxygen (LDO) in culture medium at indicated temperatures (25, 30, and 37°C). 30 + air, culture media at 30°C with aeration during culture. Data show the DO level (mean ± SEM; n = 3) in culture media. Normoxia, LDO ≥ 2 mg/liter; hypoxia, 2 > LDO ≥ 0.5 mg/liter; anoxia, LDO < 0.5 mg/liter. (C) Temperature-dependent focus formation by Eno2p-GFP under hypoxia. Values represent mean values of the proportion of cells with foci (% total cells) ± SEM (n = 3). 30°C anaerobic, cells grown at 30°C semianaerobically in culture vials; 30°C + air, cells grown at 30°C semianaerobically in culture vials with aeration; 37°C anaerobic, cells grown at 37°C semianaerobically in culture vials; 37°C + air, cells grown at 37°C semianaerobically in culture vials with aeration. ENO2-GFP/I1, the ENO2-GFP strain transformed with plasmid pULI1; ENO2::1-GFP/I1, a pULI1-transformed strain carrying genome-integrated ENO1 conjugated with GFP at the position of ENO2 (ENO2::1-GFP strain). Cells were cultivated under indicated conditions for 3, 6, 12, or 24 h and observed. (D) Determination of the focus-forming region in the Eno2p N terminus conjugated with EGFP and a FLAG tag. pUL-eno(X-Y), cells transformed with various pUL-eno(X-Y) plasmids; pUL-eno(X–25)+GGS, cells transformed with various pUL-eno(X–25)+GGS plasmids. Cells were aerobically cultivated and observed. Highlighted pictures show cells with foci: bright red, cells with clear foci; dark red, cells with unclear foci. (E) Single alanine substitution of N-terminal amino acids of Eno2p conjugated with EGFP and FLAG. pUL-eno(30), cells transformed with plasmid pUL-eno(30); XxA, cells transformed with plasmids pUL-eno(30)XxA, where X indicates a single letter of amino acid residues and x indicates the position of amino acid residues substituted with alanine. Cells were aerobically cultivated and observed. (F) Amino acid substitutions of the V22 residue. V22X, cells transformed with plasmids pUL-eno(30) V22X, in which the Eno2p N-terminal (aa 1 to 30) amino acid sequences carrying V22X substitution were conjugated with EGFP and a FLAG tag. Highlighted pictures show a cell's successful single amino acid substitution that blocked the focus formation. (G) Inhibition of the focus formation by substitution of alanine at residue V22. Cells were cultivated at 30°C semianaerobically for 6 h and observed. Bar, 10 μm. ENO2-GFP/pULI1, the ENO2-GFP strain transformed with pULI1; ENO2V22A-GFP/pULI1, the ENO2V22A-GFP strain transformed with pULI1. Representative data of at least 3 independent experiments are shown. White arrowheads indicate observed foci. (H) Colocalization of foci formed by N-terminal amino acids of Eno2p and full-length Eno2p under hypoxia. Cells were cultivated at 30°C semianaerobically for 12 h and observed. Bar, 5 μm. White arrowheads indicate colocalized foci.
Fig 2
Fig 2
Temperature-independent inhibition of the Eno2p focus formation by chemicals (see also Fig. S2 in the supplemental material). (A) Inhibition of focus formation by the addition of cycloheximide (CHX) at 37°C. A final concentration of 0.5 ng/ml CHX was added to culture vials before semianaerobic cultivation. Values represent mean values of the proportion of cells with foci (% total cells) ± SEM (n = 3) after 12 h of semianaerobic culture at 37°C. Data were analyzed using Student's t test. (B) Inhibition of focus formation by the addition of CHX at 30°C and 37°C. A final concentration of 5 ng/ml CHX was added to culture vials before semianaerobic cultivation at indicated temperatures. Bar, 10 μm. (C) Effects of rapamycin and farnesol on focus formation. Values represent mean values of the proportion of cells with foci (% total cells) ± SEM (n = 3) after 12 h of semianaerobic culture at 37°C. Data were analyzed using Student's t test with the Bonferroni correction for multiple comparisons. (D) Growth inhibition by the addition of rapamycin. Filled circle with solid line, 0 ng/ml rapamycin; open circle with solid line, 20 ng/ml rapamycin; filled circle with dashed line, 50 ng/ml rapamycin; open circle with dashed line, 100 ng/ml rapamycin. (E) Growth inhibition by the addition of farnesol. Filled circle with solid line, 0 mM farnesol; open circle with solid line, 0.5 mM farnesol; filled circle with dashed line, 1 mM farnesol.
Fig 3
Fig 3
Temperature-dependent inhibition of the Eno2p focus formation in SNF1 knockout mutants (see also Fig. S3 in the supplemental material). (A) Inhibition of focus formation in the ΔSNF1 ENO2-GFP strain at 30°C. Plasmid pULI1-transformed cells were cultivated at 30°C semianaerobically for 12 h and observed. Bar, 10 μm. White arrowheads indicate observed foci. (B) Values represent mean values of the proportion of cells with foci (% total cells) ± SEM (n = 3) after 24 h of semianaerobic culture at 30°C. Data were analyzed using Student's t test. (C) Compensation of the focus formation by reintroduction of SNF1. Cells were observed after 12 h of semianaerobic culture. Bar, 10 μm. Representative data of 3 independent experiments are shown. White arrowheads indicate observed foci.
Fig 4
Fig 4
Inhibition of focus formation by antioxidant and inhibitors of mitochondrial ROS production at 30°C. (A) Inhibition of focus formation by addition of the mitochondrial uncoupler CCCP. A final concentration of 0 or 50 mM CCCP was added to culture vials before cultivation. Cells were cultured semianaerobically at 30°C for 12 h and observed. Representative data of 3 independent experiments are shown. Bar, 10 μm. White arrowheads indicate observed foci. (B) Calculation of the rate of inhibition by CCCP. Values represent mean values of the proportion of cells with foci (% total cells) ± SEM (n = 3) after 12 h of semianaerobic culture at 30°C. Data were analyzed using Student's t test with the Bonferroni correction for multiple comparisons. (C) Effects of the mitochondrial inhibitor NAC and the antioxidant antimycin on focus formation. After the addition of specific reagents, cells were semianaerobically cultured at 30°C for 12 h and observed. Representative data of at least 3 independent experiments are shown. Bar, 10 μm. White arrowheads indicate observed foci. DMSO, dimethyl sulfoxide. (D) Calculation of the inhibition rate by NAC and antimycin. Values represent mean values of the proportion of cells with foci (% total cells) ± SEM (n = 3) after 12 h of semianaerobic culture at 30°C. Data were analyzed using Student's t test.
Fig 5
Fig 5
Detection of focus-forming metabolic proteins under hypoxia (see also Fig. S4 and Table S3 in the supplemental material). (A) Focus formation by plasmid-introduced recombinant Eno2p. The ΔENO2 strain transformed with various plasmids was semianaerobically cultured at 30°C for 12 h and observed. pYEX-ATG-EGFP, the plasmid used for producing EGFP-FLAG tag; pYEX-ENO2G, the plasmid for producing Eno2p conjugated with the EGFP-FLAG tag; pYEX-ENO2V22AG, the plasmid for producing the Eno2p V22A mutant conjugated with the EGFP-FLAG tag. Bar, 10 μm. Representative data of at least 3 independent experiments are shown. White arrowheads indicate observed foci. (B) Overview of identified proteins coimmunoprecipitated with recombinant Eno2p-EGFP-FLAG and Eno2V22Ap-EGFP-FLAG. Before protein extraction, cells were cultured for 12 h at 30°C semianaerobically. Data represent 2 biological replicates and 2 technical replicates (n = 4). I, 96 proteins coimmunoprecipitated with recombinant Eno2p-EGFP-FLAG and Eno2V22Ap-EGFP-FLAG; II, 29 proteins coimmunoprecipitated with recombinant Eno2p-EGFP-FLAG; III, 16 proteins coimmunoprecipitated with recombinant Eno2V22Ap-EGFP-FLAG. (C) Focus formation by metabolic enzymes and their colocalization with foci formed by N-terminal amino acid sequences conjugated with DsRed. Various GFP strains (of Pfk1p, Fba1p, Tpi1p, Tdh3p, Pgk1p, Gpm1p, and Pyk1p) or strain BY4741 transformed with the plasmid pULR-eno(1-28) were cultured semianaerobically at 30°C for 12 h and observed. Eno(1-28)-DsRed, red fluorescence from the N-terminal (aa 1 to 28) amino acid sequence of Eno2p conjugated with the DsRed monomer (shown in magenta); GFP, green fluorescence from the proteins conjugated with GFP. Bar, 5 μm. White arrowheads indicate colocalized foci (shown in white). (D) Overview of focus-forming proteins in glycolytic pathway under hypoxia. Green or gray characters indicate enzymes that formed or did not form, respectively, foci under hypoxia. (E) Focus formation by metabolic enzymes under hypoxia. Various GFP strains (of Glk1p, Pgi1p, Pfk1p, Fba1p, Tpi1p, Tdh3p, Pgk1p, Gpm1p, Pyk1p, Tal1p, Tkl1p, Pdc1p, Ald6p, Fas1p, Fas2p, and Pyc1p) transformed with the plasmid pULI1 were cultured semianaerobically at 30°C for 12 h (for Pfk1p, Fba1p, Tpi1p, Tdh3p, Pgk1p, Gpm1p, Pyk1p, Tal1p, Tkl1p, Pdc1p, Fas1p, Fas2p, and Pyc1p) or 24 h (for Pgi1p, Glk1p, and Ald6p) and observed. Bar, 10 μm. Green or gray characters indicate enzymes that formed or did not form, respectively, foci under hypoxia.
Fig 6
Fig 6
Changes in the carbon metabolic pathway of focus-forming cells (see also Fig. S5 in the supplemental material). (A) Conservation of foci after semianaerobic culture. Cells were cultivated semianaerobically at 30°C for 12 h, collected, and suspended in fresh media to an OD600 of 8.0 (green line), 4.0 (red line), or 1.0 (blue line), followed by aerobic cultivation at 25°C for 12 and 24 h. Values represent mean values of the proportion of cells with foci (% total cells) ± SEM (n = 3). (B) Scheme for the measurement of 13C incorporated in metabolites. (C) Incorporation of glucose-derived 13C into metabolites of focus-forming and -nonforming cells. Values represent mean values of 3 (for glycerol) or 4 (for other metabolites) biological replicates ± SEM (n = 3 or 4). ENO2-GFP/I1, the ENO2-GFP strain transformed with pULI1; ENO2V22A-GFP/I1, the ENO2V22A-GFP strain transformed with pULI1. Magenta and gray lines, metabolites extracted from cells after semianaerobic culture and after aerobic culture, respectively. x axis, labeled fraction; y axis, time (min). (D) Focus formation by PYC1-GFP under hypoxia. The PYC1-GFP strain transformed with pULI1 was cultured semianaerobically at 30°C for 12 h and observed. Bar, 5 μm. White arrowheads indicate colocalized foci.
Fig 7
Fig 7
Schematic illustration of the proposed regulation and biological role of focus formation. Dotted arrows show possible mechanisms of focus formation at higher temperatures by the involvement of increased mitochondrial electron transport activity.

References

    1. Eby LA, Crowder LB. 2002. Hypoxia-based habitat compression in the Neuse River Estuary: context-dependent shifts in behavioral avoidance thresholds. Can. J. Fish. Aquat. Sci. 59:952–965
    1. Buzzelli CP, Luettich RA, Powers SP, Peterson CH, McNinch JE, Pinckney JL, Paerl HW. 2002. Estimating the spatial extent of bottom-water hypoxia and habitat degradation in a shallow estuary. Mar. Ecol. Prog. Ser. 230:103–112
    1. Hagen T, Taylor CT, Lam F, Moncada S. 2003. Redistribution of intracellular oxygen in hypoxia by nitric oxide: effect on HIF1α. Science 302:1975–1978 - PubMed
    1. Frezza C, Zheng L, Tennant DA, Papkovsky DB, Hedley BA, Kalna G, Watson DG, Gottlieb E. 2011. Metabolic profiling of hypoxic cells revealed a catabolic signature required for cell survival. PLoS One 6:e24411.10.1371/journal.pone.0024411 - DOI - PMC - PubMed
    1. Denko NC. 2008. Hypoxia, HIF1 and glucose metabolism in the solid tumour. Nat. Rev. Cancer 8:705–713 - PubMed

Publication types

MeSH terms