Review
. 2013 Sep;28(5):284-90.
doi: 10.1097/RTI.0b013e318298733c.

Quantitative computed tomography in chronic obstructive pulmonary disease

Affiliations
Review

Quantitative computed tomography in chronic obstructive pulmonary disease

David A Lynch et al. J Thorac Imaging. 2013 Sep.

Abstract

Quantitative computed tomography is being increasingly used to quantify the features of chronic obstructive pulmonary disease, specifically emphysema, air trapping, and airway abnormality. For quantification of emphysema, the density mask technique is most widely used, with threshold on the order of-950 HU, but percentile cutoff may be less sensitive to volume changes. Sources of variation include depth of inspiration, scanner make and model, technical parameters, and cigarette smoking. On expiratory computed tomography (CT), air trapping may be quantified by evaluating the percentage of lung volume less than a given threshold (eg, -856 HU) by comparing lung volumes and attenuation on expiration and inspiration or, as done more recently, by coregistering inspiratory and expiratory CT scans. All of these indices correlate well with the severity of physiological airway obstruction. By constructing a 3-dimensional model of the airway from volumetric CT, it is possible to measure dimensions (external and internal diameters and airway wall thickness) of segmental and subsegmental airways orthogonal to their long axes. Measurement of airway parameters correlates with the severity of airflow obstruction and with the history of chronic obstructive pulmonary disease exacerbation.


Figures
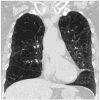
Figure 1
Figure 1
Sixty-four year old cigarette smoker with severe COPD (GOLD Stage 4). (a) Coronal inspiratory image shows moderate upper lung predominant emphysema. (b) Density mask overlay identifies voxels with CT attenuation ≤-950 HU, color coded by lung lobe. (c) Three dimensional representation provides an index of the size of the low attenuation clusters. (d) Coronal expiratory image shows gas trapping predominantly in areas of emphysema. (e) Density mask overlay of expiratory image identifies voxels with attenuation ≤-856 HU, color coded by lung lobe.
Figure 1
Figure 1
Sixty-four year old cigarette smoker with severe COPD (GOLD Stage 4). (a) Coronal inspiratory image shows moderate upper lung predominant emphysema. (b) Density mask overlay identifies voxels with CT attenuation ≤-950 HU, color coded by lung lobe. (c) Three dimensional representation provides an index of the size of the low attenuation clusters. (d) Coronal expiratory image shows gas trapping predominantly in areas of emphysema. (e) Density mask overlay of expiratory image identifies voxels with attenuation ≤-856 HU, color coded by lung lobe.
Figure 2
Figure 2
Scatterplot of 2619 subjects with moderate COPD (GOLD Stage 2: color coded green, and GOLD Stage 3: color coded blue) enrolled in the COPDGene study, with cutoff values based on normal subjects shows that 1% have predominant emphysema, 59% have mixed emphysema and gas trapping, 25% have predominant gas trapping, while 15% fall within the normal range for emphysema and gas trapping.
Figure 3
Figure 3
Images from a 70 year old woman with GOLD Stage 2 COPD demonstrating registration of inspiratory and expiratory images, and subtraction. Top row: Segmented inspiration and expiration images. Second Row: Inspiration scan with density mask set at -950 HU and the corresponding expiration scan with density mask set at -850 HU. Third row: the registered inspiration image on the left has been deformed to match the original expiratory image on the right. Bottom row: Subtraction image, obtained by subtracting the value at inspiration from the value at expiration per voxel, and ventilation image, constructed based on the deformed inspiratory image and the expiratory image (32). Images courtesy of Dr Eva van Rikxoort, Radboud University Nijmegen Medical Centre
Figure 4
Figure 4
(Same patient as Figure 1). (a) Automated airway segmentation provides a rendering of the central airway tree, with labeling of bronchial branches. (b) Curved planar reformation of bronchial pathway to right lower lobe posterior segmental bronchus (RB10). (c) Orthogonal cross section of RB10 facilitates cross-sectional measurement of bronchial luminal and wall parameters.
Figure 4
Figure 4
(Same patient as Figure 1). (a) Automated airway segmentation provides a rendering of the central airway tree, with labeling of bronchial branches. (b) Curved planar reformation of bronchial pathway to right lower lobe posterior segmental bronchus (RB10). (c) Orthogonal cross section of RB10 facilitates cross-sectional measurement of bronchial luminal and wall parameters.

References

    1. Centers for Disease Control. Deaths: Final Data for 2010. 2013 [cited 2013 Feb 23, 2013]; Available from: http://www.cdc.gov/nchs/data/dvs/deaths_2010_release.pdf. - PubMed
    1. Global initiative for chronic obstructive lung disease. Global strategy for the diagnosis, management, and prevention of chronic obstructive pulmonary disease. 2013 [cited 2013]; Available from: http://www.goldcopd.org/uploads/users/files/GOLD_Report_2013_Feb20.pdf. - PubMed
    1. Gietema HA, Schilham AM, van Ginneken B, van Klaveren RJ, Lammers JW, Prokop M. Monitoring of smoking-induced emphysema with CT in a lung cancer screening setting: detection of real increase in extent of emphysema. Radiology. 2007 Sep;244(3):890–7. - PubMed
    1. Han MK, Kazerooni EA, Lynch DA, Liu LX, Murray S, Curtis JL, et al. Chronic obstructive pulmonary disease exacerbations in the COPDGene study: associated radiologic phenotypes. Radiology. 2011 Oct;261(1):274–82. - PMC - PubMed
    1. Coxson HO, Dirksen A, Edwards LD, Yates JC, Agusti A, Bakke P, et al. The presence and progression of emphysema in COPD as determined by CT scanning and biomarker expression: a prospective analysis from the ECLIPSE study. Lancet Respiratory Medicine. 2013 - PubMed

Publication types

MeSH terms