. 2013 Jul;45(7):723-9.
doi: 10.1038/ng.2658. Epub 2013 Jun 9.

Genome-wide inference of natural selection on human transcription factor binding sites

Affiliations

Genome-wide inference of natural selection on human transcription factor binding sites

Leonardo Arbiza et al. Nat Genet. 2013 Jul.

Abstract

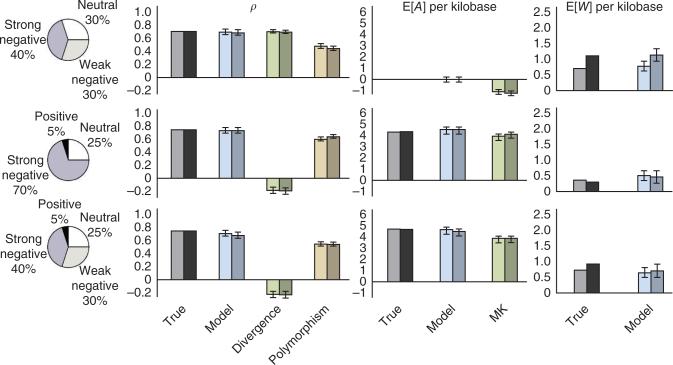
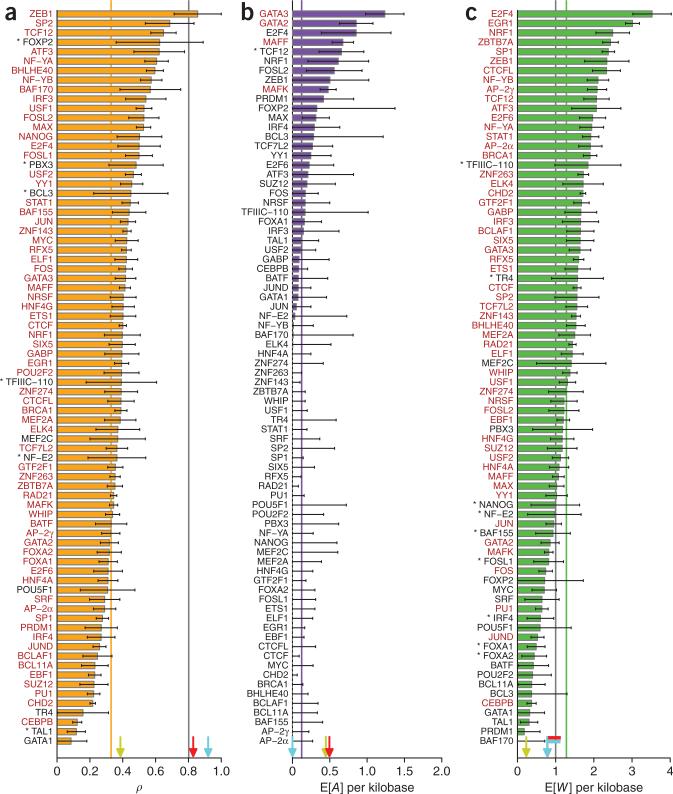
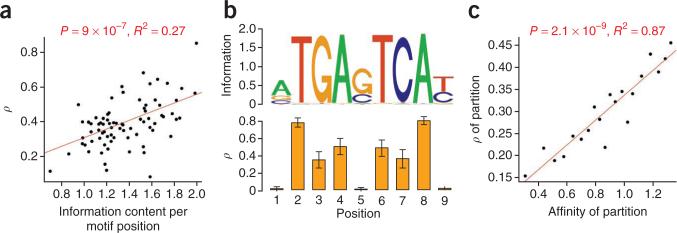
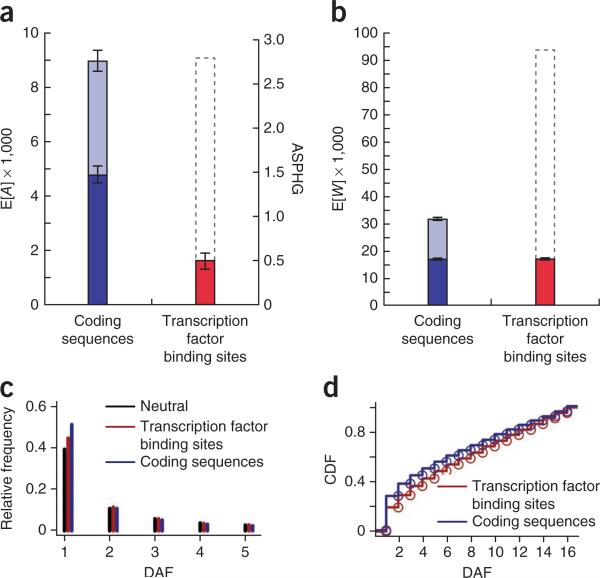
For decades, it has been hypothesized that gene regulation has had a central role in human evolution, yet much remains unknown about the genome-wide impact of regulatory mutations. Here we use whole-genome sequences and genome-wide chromatin immunoprecipitation and sequencing data to demonstrate that natural selection has profoundly influenced human transcription factor binding sites since the divergence of humans from chimpanzees 4-6 million years ago. Our analysis uses a new probabilistic method, called INSIGHT, for measuring the influence of selection on collections of short, interspersed noncoding elements. We find that, on average, transcription factor binding sites have experienced somewhat weaker selection than protein-coding genes. However, the binding sites of several transcription factors show clear evidence of adaptation. Several measures of selection are strongly correlated with predicted binding affinity. Overall, regulatory elements seem to contribute substantially to both adaptive substitutions and deleterious polymorphisms with key implications for human evolution and disease.


Figures

Figure 1
Figure 1
Results for data sets simulated under three different mixtures of selective modes. Four selective modes (pie charts) are considered: neutral evolution (2Nes = 0), weak negative selection (2Nes = –10), strong negative selection (2Nes = –100) and positive selection (2Nes = 10). Bars represent the fraction of nucleotides under selection (ρ) and the expected numbers of adaptive substitutions (E[A]) and weakly deleterious polymorphisms (E[W]) per kilobase of transcription factor binding site sequence analyzed. Separate bars are shown for true values in the simulations and model-based estimates. Estimates of ρ are additionally compared with simple estimators based on divergence and polymorphism rates, and estimates for E[A] per kilobase are compared with a McDonald-Kreitman–based estimator (MK). The first bar in each pair represents simulations with constant population sizes, and the second bar represents a realistically complex demographic scenario for human populations. The nonzero values of E[W] per kilobase in the absence of weak negative selection (second row) reflect residual polymorphism in strongly selected sites. Error bars, 1 s.e.m. (additional results are shown in supplementary Figs. 12 and 13, and further details are given in the supplementary Note).
Figure 2
Figure 2
Estimates of key parameters for the binding sites of each transcription factor in our study. (ac) Shown are estimates of the fraction of nucleotides under selection (ρ) (a), the expected number of adaptive substitutions per kilobase (E[A] per kilobase) (b) and the expected number of deleterious mutations per kilobase (E[W] per kilobase) (c). Weighted averages are indicated by lines in matching colors. Estimates for second codon positions in protein-coding sequences (CDS2) are shown for comparison (dark-gray lines). Arrows indicate estimates for CDS2 sites in subsets of genes identified as being under positive selection in mammalian phylogenies (yellow) or human populations (red) or denoted as housekeeping genes on the basis of gene expression patterns (light blue) (supplementary note). Flags in c indicate overlapping arrows. Transcription factor names in red indicate statistical significance after a correction for multiple tests (adjusted P < 0.05). Asterisks indicate nominal P < 0.05. Error bars, 1 s.e.m. (additional results are shown in supplementary Fig. 2 and supplementary Table 2). Notably, these estimates are fairly insensitive to the threshold for low-frequency derived alleles (supplementary Fig. 14).
Figure 3
Figure 3
Information content, binding affinity and selection. (a) Information content per motif position versus estimates of ρ (the fraction of sites under selection) for the 78 transcription factors analyzed in our study. (b) Motif logo for JUND (top) and position-specific estimates of ρ (bottom). Error bars, 1 s.e.m. Notice that positions with high information content tend to be under selection, and positions with low information content tend not to be under selection. This relationship holds for some but not all transcription factors. (c) Predicted binding affinity versus ρ. All binding sites were partitioned into 20 equally sized bins by predicted binding affinity, and ρ was estimated separately for each partition using INSIGHT. Additional details are given in the supplementary Note.
Figure 4
Figure 4
Genome-wide analyses of adaptive and deleterious mutations in protein-coding sequences and transcription factor binding sites. (a) Expected numbers of adaptive substitutions on the human lineage (E[A]). The analysis was performed on a subset of genes that passed rigorous data quality filters (dark blue), and results were extrapolated to a full set of genes (light blue) (supplementary Note). The gray dashed outline for transcription factor binding sites indicates a crude extrapolation to the entire genome, assuming that two nucleotides function in gene regulation for every one that encodes proteins. The alternative y axis (right) shows estimated adaptive substitutions per hundred generations (ASPHG). Error bars indicate 1 s.e.m. above and below the mean (supplementary Note). (b) Plot as in a showing expected numbers of weakly deleterious polymorphisms (E[W]). (c) Site frequency spectra (SFS) for polymorphic sites in transcription factor binding sites, coding sequences and neutral flanking sequences. The first 5 derived allele frequencies (DAFs) are shown as counts out of 108 chromosomes (complete results in supplementary Fig. 15). (d) Cumulative distribution function (CDF) for expected weakly deleterious mutations per haploid genome (E[D]) in transcription factor binding site and coding sequences. Notice that the distribution is shifted toward more common alleles in transcription factor binding sites. Results are similar with alternative thresholds for low-frequency alleles.

Comment in

References

    1. Ohno S. An argument for the genetic simplicity of man and other mammals. J. Hum. Evol. 1972;1:651–662.
    1. King MC, Wilson AC. Evolution at two levels in humans and chimpanzees. Science. 1975;188:107–116. - PubMed
    1. Wilson AC, Maxson LR, Sarich VM. Two types of molecular evolution. Evidence from studies of interspecific hybridization. Proc. Natl. Acad. Sci. USA. 1974;71:2843–2847. - PMC - PubMed
    1. Britten RJ, Davidson EH. Gene regulation for higher cells: a theory. Science. 1969;165:349–357. - PubMed
    1. Stern DL. Evolutionary developmental biology and the problem of variation. Evolution. 2000;54:1079–1091. - PubMed

Publication types

Substances