. 2013 Jul;45(7):784-90.
doi: 10.1038/ng.2656. Epub 2013 Jun 9.

Mycobacterium tuberculosis mutation rate estimates from different lineages predict substantial differences in the emergence of drug-resistant tuberculosis

Affiliations

Mycobacterium tuberculosis mutation rate estimates from different lineages predict substantial differences in the emergence of drug-resistant tuberculosis

Christopher B Ford et al. Nat Genet. 2013 Jul.

Abstract

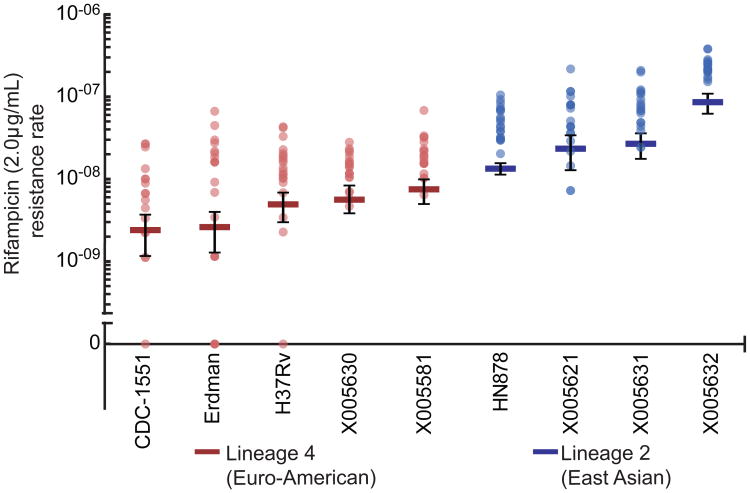
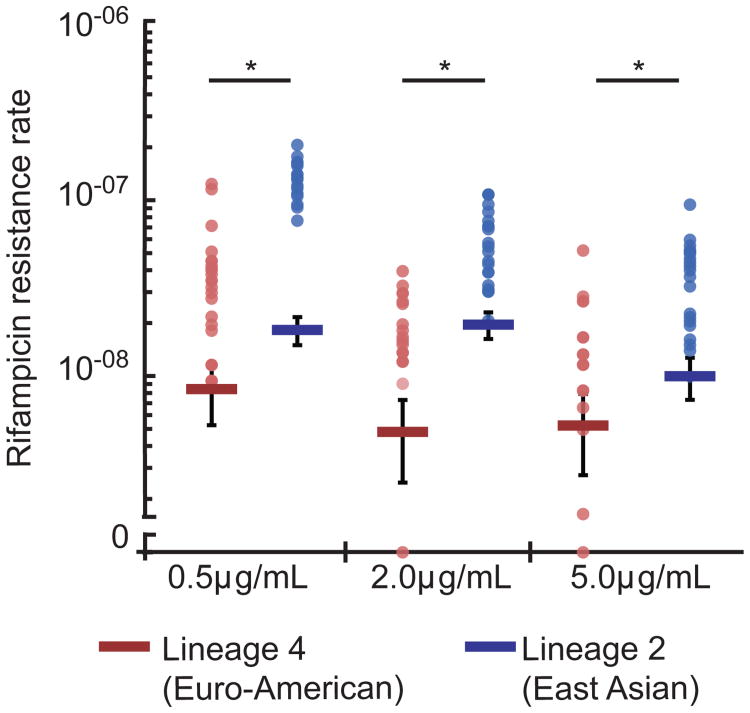
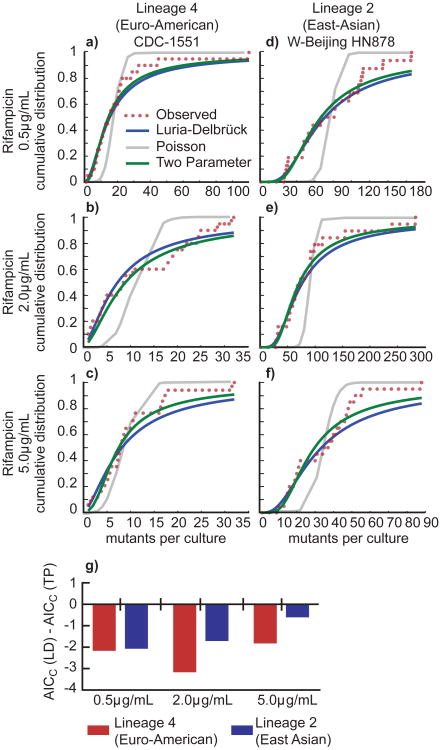
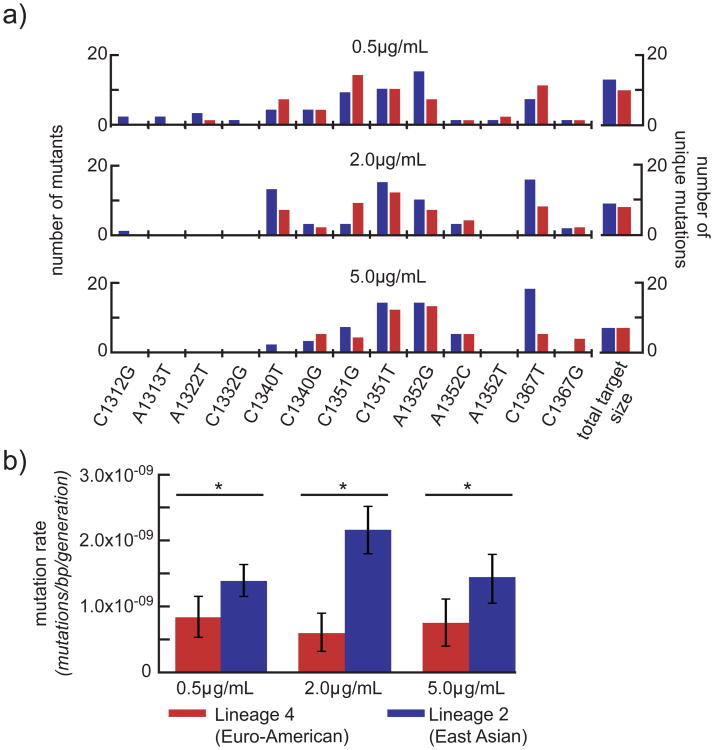
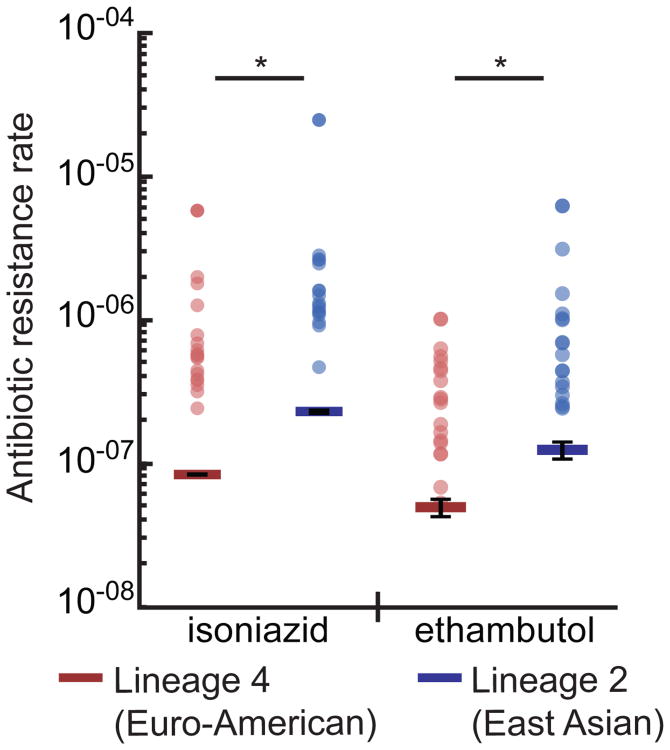
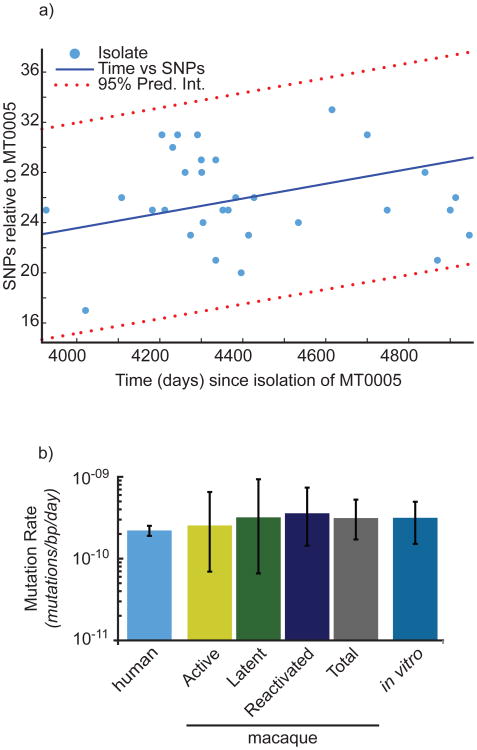
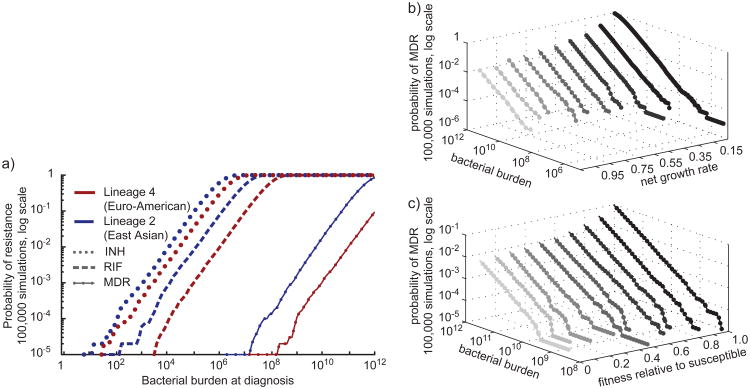
A key question in tuberculosis control is why some strains of M. tuberculosis are preferentially associated with resistance to multiple drugs. We demonstrate that M. tuberculosis strains from lineage 2 (East Asian lineage and Beijing sublineage) acquire drug resistances in vitro more rapidly than M. tuberculosis strains from lineage 4 (Euro-American lineage) and that this higher rate can be attributed to a higher mutation rate. Moreover, the in vitro mutation rate correlates well with the bacterial mutation rate in humans as determined by whole-genome sequencing of clinical isolates. Finally, using a stochastic mathematical model, we demonstrate that the observed differences in mutation rate predict a substantially higher probability that patients infected with a drug-susceptible lineage 2 strain will harbor multidrug-resistant bacteria at the time of diagnosis. These data suggest that interventions to prevent the emergence of drug-resistant tuberculosis should target bacterial as well as treatment-related risk factors.


Figures

Figure 1
Figure 1. Lineage 2 strains more rapidly acquire rifampicin resistance
Fluctuation analysis was used to determine the rifampicin (2μg/mL) resistance rate of clinical and laboratory strains from both Lineage 2 and Lineage 4. Strains from Lineage 4 are in red; strains from Lineage 2 are in blue. Circles represent mutation frequency (number of mutants per cell plated in a single culture), where darker circles represent multiple cultures with the same frequency. Bars represent the estimated mutation rate, with error bars representing the 95% confidence interval. Strains are displayed on the x-axis and the rifampicin resistance rate is displayed on the y-axis in log-scale. Values are listed in Supplementary Table 1.
Figure 2
Figure 2. Altering drug concentration does not alter the observation that Lineage 2 strains more rapidly acquire rifampicin resistance
Fluctuation analysis was used to determine the rifampicin (0.5, 2, 5μg/mL) resistance mutation rate of representative strains from both Lineage 2 and Lineage 4 (HN878 and CDC1551, respectively). The Lineage 4 strain CDC1551 is in red, and the Lineage 2 strain HN878 is in blue. Circles represent mutation frequency (number of mutants per cell plated in a single culture), where darker circles represent multiple cultures with the same frequency. Bars represent the estimated mutation rate, with error bars representing the 95% confidence interval. Significance was determined by comparing strain pairs using the Wilcoxon rank-sum test. Strains are displayed on the x-axis and the rifampicin resistance rate is displayed on the y-axis in log-scale. Values are listed in Supplementary Table 1.
Figure 3
Figure 3. The cumulative distribution of drug resistant mutants from both lineages indicates that mutations do not occur after exposure to antibiotic
(a) Curve fitting analysis was performed to determine if the cumulative distribution of the fluctuation analysis data from Lineage 4 strain CDC-1551 plated on rifampicin, 0.5μg/mL better fit a one-parameter Luria-Delbrück (LD) model, a one parameter Poisson model (Poiss), or a two-parameter Luria-Delbrück and Poisson mixture model (TP). The number of mutants per culture is displayed on the x-axis, and the probability of observing x or fewer mutants per culture is shown on the y-axis. (b) Fitting as in (a) for Lineage 2 strain HN878 plated on rifampicin, 0.5μg/mL. (c) Fitting as in (a) for Lineage 4 strain CDC-1551 plated on rifampicin, 2μg/mL. (d) Fitting as in (a) for Lineage 2 strain HN878 plated on rifampicin, 2μg/mL. (e) Fitting as in (a) data for Lineage 4 strain CDC-1551 plated on rifampicin, 5μg/mL. (f) Fitting as in (a) data for Lineage 2 strain HN878 plated on rifampicin, 5μg/mL. (g) To determine which model best fit each data set, we determined the Akaike Information Criterion, corrected for small sample size (AICC). A smaller AICC represents a better fit, given a penalty for more parameters in a model. If the AICC(LD) is smaller than the AICC(TP), then the resulting value will be negative, reflecting a better fit for the LD model (see Supplementary Table 2).
Figure 4
Figure 4. Small differences in target size and differences in basal mutation rate are responsible for the observed differences drug resistance rate
(a) The target size (the number of mutations conferring rifampicin resistance) of each strain under each condition was determined by sequencing the rifampicin resistance determining region of 100 isolates from each strain in each condition. Each mutation is shown on the x-axis, with coordinates representing position within rpoB (Rv0667). The number of mutants per strain uniquely formed within a culture is shown on the y-axis. The Lineage 4 strain, CDC1551, is shown in red; the Lineage 2 strain is shown in blue. On the right, the target size - the number of unique mutations conferring rifampicin resistance – is shown. (b) The per base pair mutation rate is determined by normalizing the drug resistance rate by target size. Drug concentration is shown on the x-axis, mutation rate per base pair is shown on a linear scale on the y-axis. Lineage 4 is shown in red; Lineage 2 is shown in blue. Significance was determined by comparing strain pairs using the Wilcoxon rank-sum test; error bars represent 95% confidence intervals. Values are found in Supplementary Table 4.
Figure 5
Figure 5. A representative Lineage 2 strain acquires isoniazid and ethambutol resistance at a higher rate
Fluctuation analysis was used to determine the isoniazid (1μg/mL) and ethambutol (5μg/mL) resistance rate for the Lineage 4 strain, CDC1551, (shown in red) and the Lineage 2 strain, HN878 (shown in blue). Circles represent mutation frequency (number of mutants per cell in a single culture), where darker circles represent multiple cultures with the same frequency. Bars represent the estimated mutation rate, with error bars representing the 95% confidence interval. Significance was determined by non-overlapping 95% confidence interval. Values are listed in Supplementary Table 1.
Figure 6
Figure 6. Bayesian MCMC analysis reveals a mutation rate in humans similar to that estimated in strains from the macaque model and in vitro
(a) The number of SNPs and the number of days separating the clinical isolate and MT0005 are plotted. SNPs located in repeat regions (PE_PGRSs, PPEs, and transposable elements) were excluded, consistent with our previous analysis. The data are fit to a first order polynomial to illustrate the trend. (b) Estimates of mutation rate in human isolates were derived by reconstructing the phylogeny from the isolates represented in (a). Mutation rate is shown on the y-axis in log scale. Estimates of mutation rate from the macaque model and the infecting strain, Erdman (in vitro) were determined previously. Error bars represent 95% confidence intervals.
Figure 7
Figure 7. A stochastic simulation mathematical model predicts the emergence of MDR-TB before the onset of treatment
(a) Estimates of the probability of observing MDR within a population were derived using a stochastic mathematical model of resistance in 200,000 simulations, 100,000 for each lineage. Model parameters are listed in Supplementary Table 6. Bacterial burden at diagnosis is shown on the x-axis, the probability of observing resistance is shown on the y-axis in log scale. Estimates for Lineage 4 are shown in red, Lineage 2 in blue. (b, c) To determine the sensitivity of our model to variations in growth rate and fitness, we varied each parameter (see Supplementary Table 6) and determined the probability of observing resistance (z-axis, log scale) at any given bacterial burden (y-axis, log scale) for a specified parameter set (x-axis).

Comment in

References

    1. Velayati AA, et al. Emergence of new forms of totally drug-resistant tuberculosis bacilli: super extensively drug-resistant tuberculosis or totally drug-resistant strains in Iran. Chest. 2009;136:420–425. - PubMed
    1. Udwadia ZF, Amale RA, Ajbani KK, Rodrigues C. Totally Drug-Resistant Tuberculosis in India. Clin Infect Dis. 2011 doi: 10.1093/cid/cir889. - DOI - PubMed
    1. Migliori GB, De Iaco G, Besozzi G, Centis R, Cirillo DM. First tuberculosis cases in Italy resistant to all tested drugs. Euro Surveill. 2007;12:E070517.1. - PubMed
    1. Gandhi NR, et al. Multidrug-resistant and extensively drug-resistant tuberculosis: a threat to global control of tuberculosis. Lancet. 2010;375:1830–1843. - PubMed
    1. David HL. Probability distribution of drug-resistant mutants in unselected populations of Mycobacterium tuberculosis. Applied microbiology. 1970;20:810–814. - PMC - PubMed

Publication types

MeSH terms

Substances