. 2013 Jul 15;191(2):773-84.
doi: 10.4049/jimmunol.1300113. Epub 2013 Jun 7.

Microenvironments in tuberculous granulomas are delineated by distinct populations of macrophage subsets and expression of nitric oxide synthase and arginase isoforms

Affiliations

Microenvironments in tuberculous granulomas are delineated by distinct populations of macrophage subsets and expression of nitric oxide synthase and arginase isoforms

Joshua T Mattila et al. J Immunol. .

Abstract

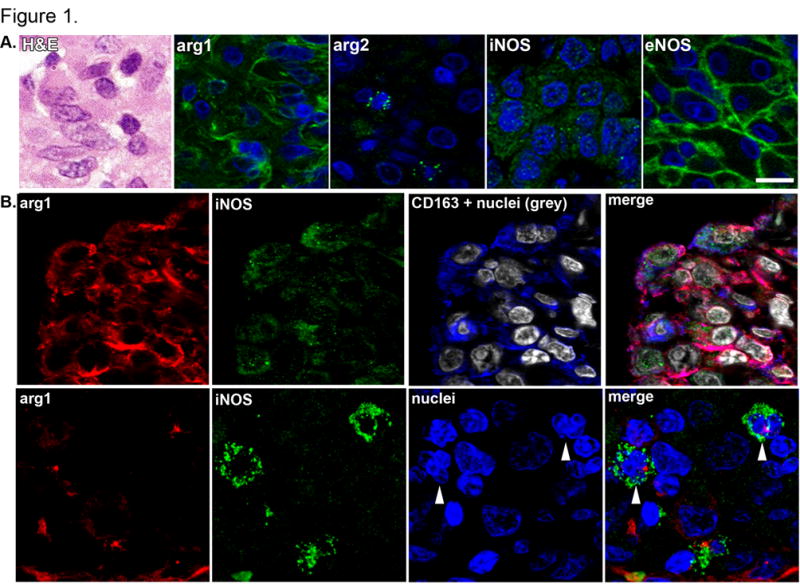
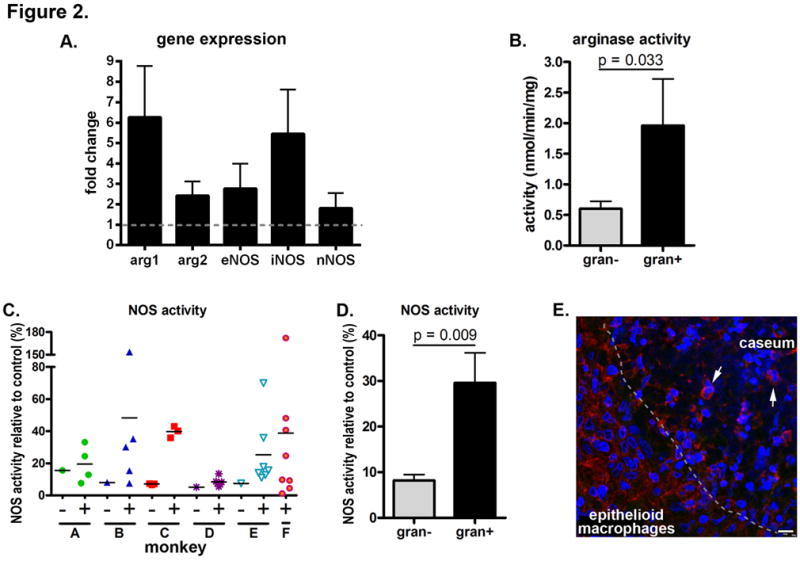
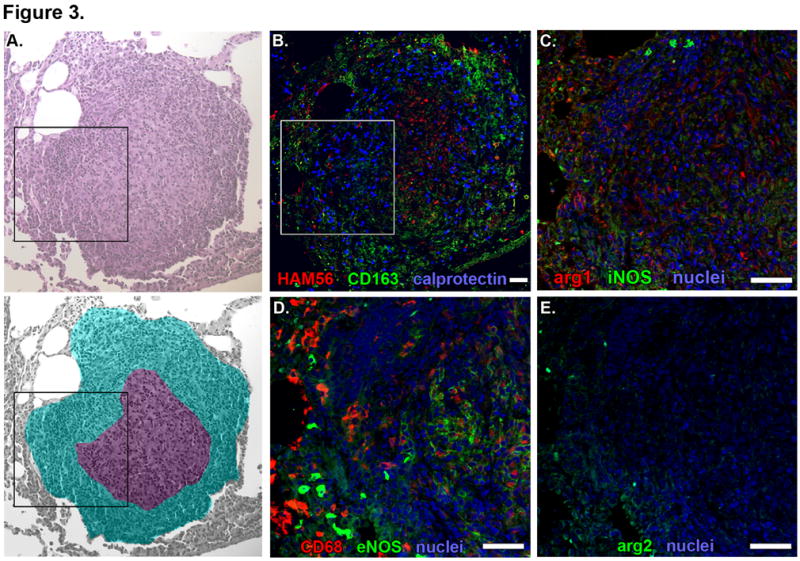
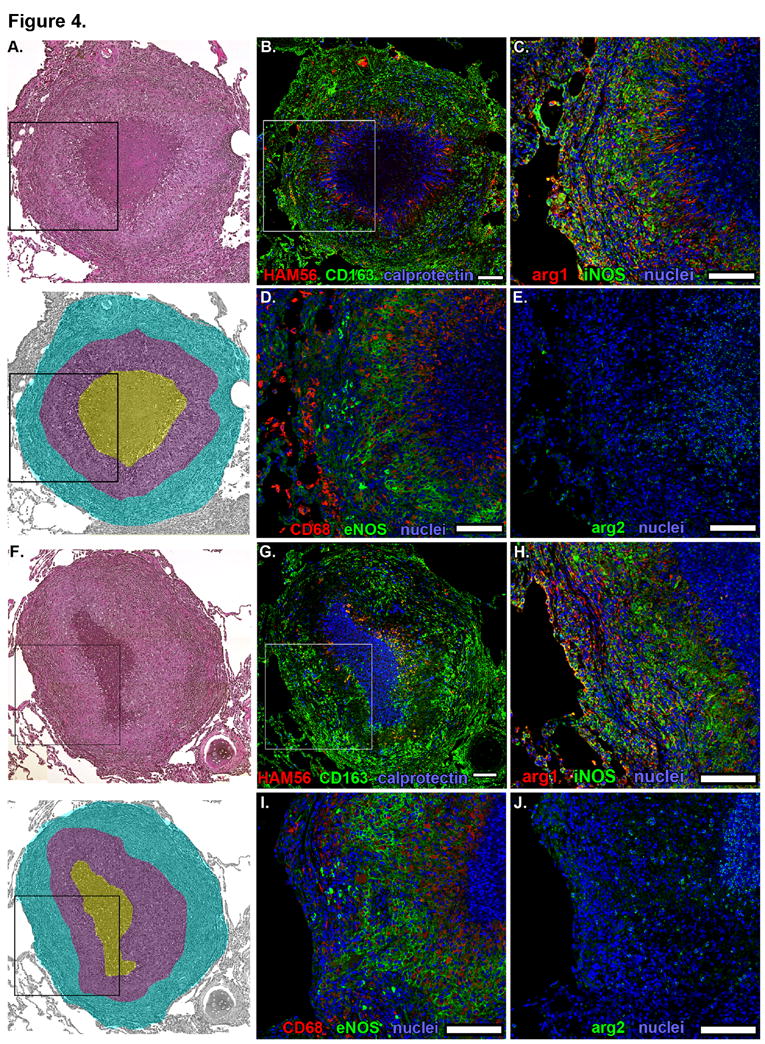
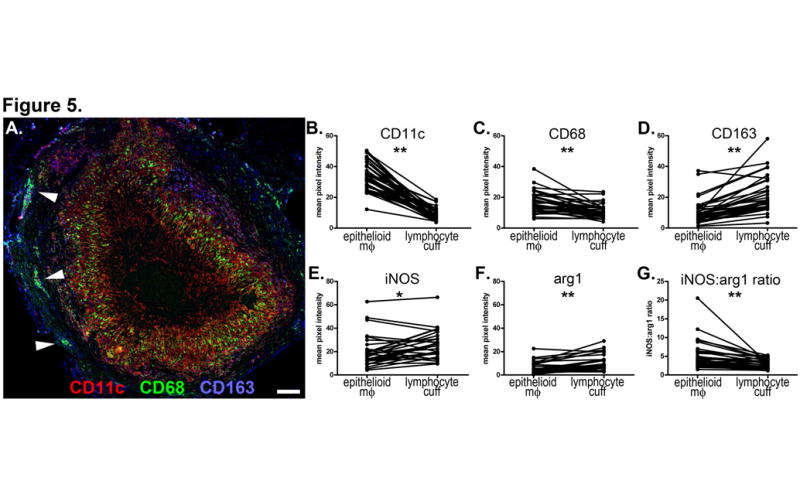
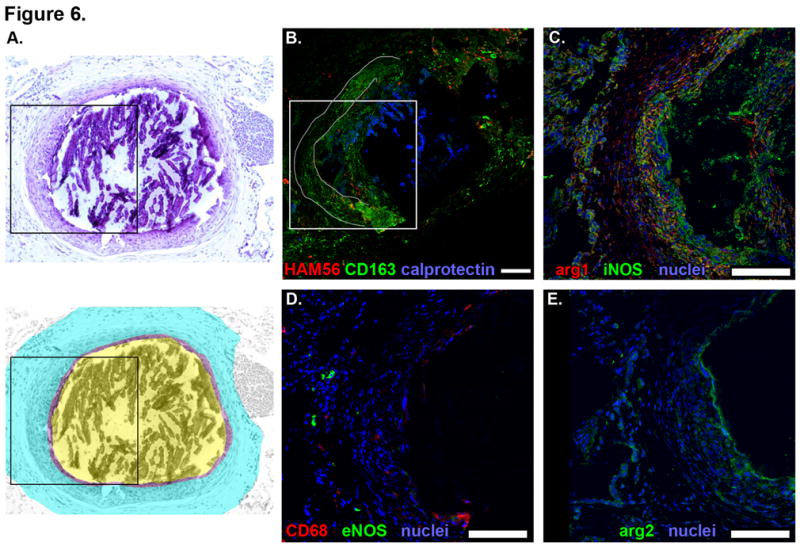
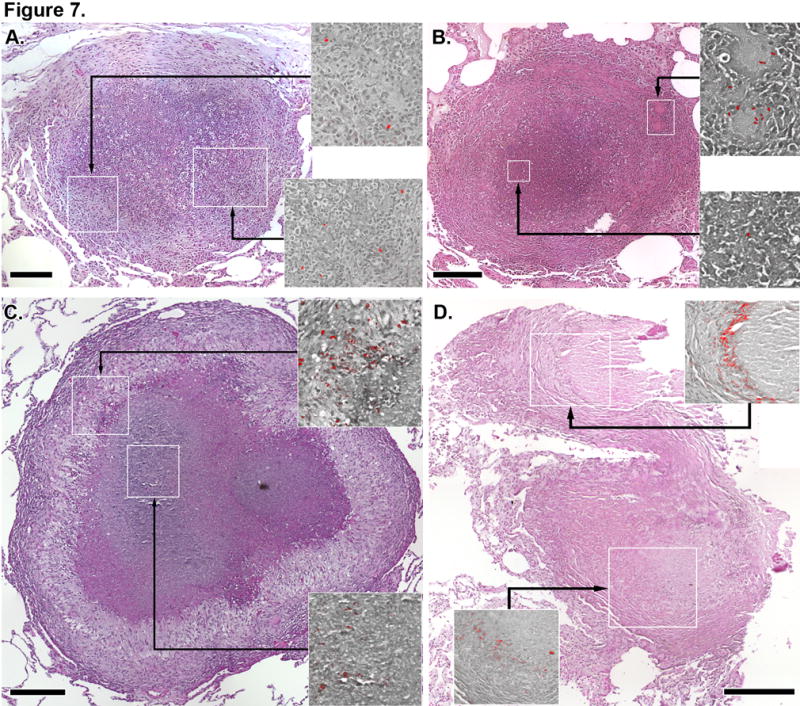
Macrophages in granulomas are both antimycobacterial effector and host cell for Mycobacterium tuberculosis, yet basic aspects of macrophage diversity and function within the complex structures of granulomas remain poorly understood. To address this, we examined myeloid cell phenotypes and expression of enzymes correlated with host defense in macaque and human granulomas. Macaque granulomas had upregulated inducible and endothelial NO synthase (iNOS and eNOS) and arginase (Arg1 and Arg2) expression and enzyme activity compared with nongranulomatous tissue. Immunohistochemical analysis indicated macrophages adjacent to uninvolved normal tissue were more likely to express CD163, whereas epithelioid macrophages in regions where bacteria reside strongly expressed CD11c, CD68, and HAM56. Calprotectin-positive neutrophils were abundant in regions adjacent to caseum. iNOS, eNOS, Arg1, and Arg2 proteins were identified in macrophages and localized similarly in granulomas across species, with greater eNOS expression and ratio of iNOS/Arg1 expression in epithelioid macrophages as compared with cells in the lymphocyte cuff. iNOS, Arg1, and Arg2 expression in neutrophils was also identified. The combination of phenotypic and functional markers support that macrophages with anti-inflammatory phenotypes localized to outer regions of granulomas, whereas the inner regions were more likely to contain macrophages with proinflammatory, presumably bactericidal, phenotypes. Together, these data support the concept that granulomas have organized microenvironments that balance antimicrobial anti-inflammatory responses to limit pathology in the lungs.


Figures

Figure 1
Figure 1. Immunohistochemical identification of arginase and NOS isoforms in cells from cynomolgus macaque granulomas
A. Epithelioid macrophages, as depicted by hematoxylin and eosin staining (H&E) were stained for Arg1, Arg2, iNOS and eNOS (green) and nuclei (blue) and imaged at 600x magnification to represent the unique staining patterns associated with each enzyme. Each panel presents an independent set of epithelioid macrophages in the macrophage region, scale bar represents 20 μm. B. Co-expression of Arg1 (red) and iNOS (green) in CD163+ macrophages (blue, top panel) and in cells with segmented neutrophil-like nuclei (arrowheads, bottom panel). Image acquired at 600x magnification, scale bar represents 20 μm.
Figure 2
Figure 2. Granulomas contain higher levels of arginase and NOS activity and gene expression than uninvolved lung tissue
Arginase and NOS enzyme activity is from independent experiments using tissues from different animals. A. Relative transcript quantification where granuloma-containing tissues (n=8) are compared against relative transcript abundance in uninvolved tissues (n=4) from four animals. Data represent the mean ± SEM. B. Arginase activity was measured from four uninvolved tissues and six granulomas from five monkeys. Statistical comparison by the Mann-Whitney test. C. NOS activity was measured from seven uninvolved tissues (−) and 35 granulomas (+) from seven animals (A – m23210, B – m21410, C – m22210, D – m5210, E – m22510, F – m22910) showing a trend where involved tissues have more functional enzyme than uninvolved tissue. D. Aggregated data from Figure 2C indicating granulomas have significantly higher mean NOS activity than uninvolved tissues. Statistical comparison by the Mann-Whitney test. E. Immunohistochemical staining of a necrotic granuloma showing strong nitrotyrosine staining at the epithelioid macrophage – caseum interface (indicated by a dashed line) with significant numbers of macrophages and some cells having segmented neutrophil-like nuclei (arrows) that stain positively for nitrotyrosine (red). Scale bar represents 10 μm.
Figure. 3
Figure. 3. Macrophage phenotypes and distribution in non-necrotic granulomas from macaques with active TB
Individual panels show serial 5-μm thick sections of a representative non-necrotic granuloma. A. Hematolylin and eosin staining (top) with a pseudocolored representation (bottom) indicating lymphocyte-rich (cyan) and epithelioid macrophage-rich (purple) regions. Black box indicates the region depicted at higher magnification in images C-E. B. Macrophage-specific stains including HAM56 (red), CD163 (green) and calprotectin-stained neutrophils (blue). White box indicates the region depicted at higher magnification in images C-E. C. iNOS (green) and Arg1 (red) expression with nuclei (blue). D. CD68 (red) and eNOS (green) expression with nuclei (blue). E. Arg2 (green) expression with nuclei (blue). Scale bars represent 100 μm.
Figure. 4
Figure. 4. Macrophage phenotypes and distribution in necrotic and suppurative granulomas from macaques with active TB
Individual panels show serial 5-μm thick sections of representative necrotic and suppurative granulomas. Hematoxylin and eosin staining (top) of a necrotic (A) and suppurative (F) granulomas with pseudocolored representation (bottom) indicating lymphocyte-rich (cyan), epithelioid macrophage-rich (purple) and necrotic (yellow, panel A) or suppurative (yellow, panel F) regions. Black boxes indicate the regions depicted at higher magnification in images C-E and G-J. B, G. Macrophage-specific stains including HAM56 (red), CD163 (green) and calprotectin-stained neutrophils (blue). White box indicates the region depicted at higher magnification in images C-E. C, H. iNOS (green) and Arg1 (red) expression with nuclei (blue). D, I. CD68 (red) and eNOS (green) expression with nuclei (blue). E, J. Arg2 (green) expression with nuclei (blue). Scale bars represent 100 μm.
Figure 5
Figure 5. Region-specific expression of macrophage markers, iNOS and Arg1 in necrotic granulomas
A. A necrotic granuloma stained for CD11c (red), CD68 (green) and CD163 (blue) showing distinct stratification of cell populations. Arrowheads indicate clusters of CD11c+CD68+CD163+ alveolar macrophage-like cells. 100x magnification, scale bar represents 100 μm. B-G. Image analysis of necrotic granulomas comparing fluorescence signal intensity of epithelioid macrophage and lymphocyte cuff regions in necrotic granulomas from 4 monkeys (panels B-D: n=37 fields from 18 granulomas, panels E-G: n=30 fields from 18 granulomas). The fields imaged for panels B-D are different from panels E-G but come from granulomas in the same tissue section. B. CD11c. C. CD68. D. CD163. E. iNOS. F. Arg1. G. ratio of iNOS:Arg1 signal intensity showing decreased Arg1 expression in epithelioid macrophage region relative to the lymphocyte cuff. Pairwise comparisons by the Wilcoxon matched-pairs signed rank test;* p=0.062, ** p<0.0001.
Figure. 6
Figure. 6. Macrophage phenotypes and distribution in fibrocalcific granulomas from macaques with latent TB
Individual panels show serial 5-μm thick sections of a representative necrotic granuloma. A. Hematoxylin and eosin (top) with pseudocolored representation (bottom) indicating the outer fibrotic region (cyan), fibro-calcific interface (purple) and central region containing mineralized material (yellow) that shattered during cutting. Dashed line indicates portion of the fibrocalcific interface that is separated from the rest of the granuloma and is present as an artifact in A. Black box indicates the region depicted at higher magnification in images C-E. B. Macrophage-specific stains including HAM56 (red), CD163 (green) and calprotectin-stained neutrophils (blue). Grey line outlines the tissue edge denoted by the dashed line in A where the fibrocalcific interface has separated from the surrounding tissue and reflected over the other side. White box indicates the region depicted at higher magnification in images C-E. C. iNOS (green) and Arg1 (red) expression with nuclei (blue). D. CD68 (red) and eNOS (green) expression with nuclei (blue). E. Arg2 (green) expression with nuclei (blue). Scale bars represent 100 μm.
Figure 7
Figure 7. Bacteria and bacterial antigens can be detected in granulomas from active and latent disease
Auramine-rhodamine images (red images overlayed on grayscale hematoxylin and eosin backgrounds) indicating the presence of mycobacteria in granulomas come from regions indicated by white boxes in the colored hematoxylin and eosin-stained granuloma. Auramine-rhodamine stains come from the same tissue section as the hematoxylin and eosin-stained image. A. A necrotic granuloma with large numbers of neutrophils infiltrating into the caseum showing bacteria in epithelioid macrophages (top panel) and admixed with macrophage and neutrophils (bottom panel). B. A necrotic granuloma with bacilli in giant cells in the granuloma periphery (top panel) and in the caseum (bottom panel). C. A necrotic granuloma showing mycobacterial antigens and bacilli in epithelioid macrophages and adjacent to foamy macrophages and mycobacterial antigens in the caseum (bottom panel). D. A fibrotic granuloma from an animal with latent TB showing residual mycobacterial antigens at the interface of highly fibrotic tissue (top and bottom panels). Scale bars represent 200 μm.
Figure 8
Figure 8. Macrophage phenotypes and distribution in non-necrotic and necrotic human granulomas
Panels A-E indicate images of a non-necrotic granuloma, panels F-J indicate images of a necrotic granuloma. Black boxes (hematoxylin and eosin images) and white boxes (HAM56, CD163, calprotectin images) denote areas shown in the higher magnification Arg1/iNOS, CD68/eNOS, Arg2 panels. A, F. Hematoxylin and eosin staining. B, G. Macrophage-specific stains including HAM56 (red), CD163 (green) and calprotectin-stained neutrophils (blue). C, H. iNOS (green) and Arg1 (red) expression with nuclei (blue). D, I. CD68 (red) and eNOS (green) expression with nuclei (blue). Arrows indicate clusters of CD68+eNOS+ cells adjacent to the granuloma. E, J. Arg2 (green) expression with nuclei (blue). Scale bars represent 50 μm.

References

    1. Lawn SD, Zumla AI. Tuberculosis. Lancet. 2011;378:57–72. - PubMed
    1. Russell DG, Cardona PJ, Kim MJ, Allain S, Altare F. Foamy macrophages and the progression of the human tuberculosis granuloma. Nat Immunol. 2009;10:943–948. - PMC - PubMed
    1. Flynn JL, Klein E, editors. Pulmonary Tuberculosis in Monkeys. CRC Press, Talor & Francis Publishers; 2010.
    1. Capuano SV, 3rd, Croix DA, Pawar S, Zinovik A, Myers A, Lin PL, Bissel S, Fuhrman C, Klein E, Flynn JL. Experimental Mycobacterium tuberculosis infection of cynomolgus macaques closely resembles the various manifestations of human M tuberculosis infection. Infect Immun. 2003;71:5831–5844. - PMC - PubMed
    1. Lin PL, Rodgers M, Smith L, Bigbee M, Myers A, Bigbee C, Chiosea I, Capuano SV, Fuhrman C, Klein E, Flynn JL. Quantitative comparison of active and latent tuberculosis in the cynomolgus macaque model. Infect Immun. 2009;77:4631–4642. - PMC - PubMed

Publication types

MeSH terms