. 2013 May 30:4:92.
doi: 10.3389/fgene.2013.00092. eCollection 2013.

The Growing Importance of CNVs: New Insights for Detection and Clinical Interpretation

Affiliations

The Growing Importance of CNVs: New Insights for Detection and Clinical Interpretation

Armand Valsesia et al. Front Genet. .

Abstract

Differences between genomes can be due to single nucleotide variants, translocations, inversions, and copy number variants (CNVs, gain or loss of DNA). The latter can range from sub-microscopic events to complete chromosomal aneuploidies. Small CNVs are often benign but those larger than 500 kb are strongly associated with morbid consequences such as developmental disorders and cancer. Detecting CNVs within and between populations is essential to better understand the plasticity of our genome and to elucidate its possible contribution to disease. Hence there is a need for better-tailored and more robust tools for the detection and genome-wide analyses of CNVs. While a link between a given CNV and a disease may have often been established, the relative CNV contribution to disease progression and impact on drug response is not necessarily understood. In this review we discuss the progress, challenges, and limitations that occur at different stages of CNV analysis from the detection (using DNA microarrays and next-generation sequencing) and identification of recurrent CNVs to the association with phenotypes. We emphasize the importance of germline CNVs and propose strategies to aid clinicians to better interpret structural variations and assess their clinical implications.

Keywords: bioinformatics; complex disease; copy number variation; genome-wide association studies; genomics; personalized medicine; sequencing.


Figures

Figure 1
Figure 1
SNP and CGH array analyses. (A) Analyses with SNP and CGH arrays of two melanoma samples (Me275 a tetraploid sample and Me280 with large deletions). Probe/SNP are plotted as a function of their genomic position on the X axis. Y axis for CGH arrays corresponds to hybridization ratios. Y axis for SNP arrays corresponds to the predicted copy number. Colors indicate a copy number state (orange <2 copies; gray = 2 copies; cyan = 3 copies; dark blue >3 copies). (B) Analysis of the Me275 sample with SNP array. The top panel shows genome-wide copy number. Subsequent panels show chromosome 7 with, from top to bottom: hybridization log2 ratio, B allele frequency and copy number prediction.
Figure 2
Figure 2
NGS approaches. Analytical strategy to detect CNV from NGS data: (A) pair-end mapping approached, (B) read-depth approach, and (C) split-read approach.
Figure 3
Figure 3
Impact of CNV post-filtering on false-discovery rate (FDR). Illustration of the FDR evolution when discarding CNVs based on their length (A) or based on their confidence scores (B). (C,D) Show respectively histograms of CNV length and CNV confidence score. Fluctuations in these histograms (such as inversion of the proportion “small CNVs over long CNVs” or “low-confidence over high-confidence CNVs”) are associated with non-monotonic changes in the FDR curve.
Figure 4
Figure 4
Representation of CNV data and CNV-GWA analysis. (A) CNV representation on chromosome 10 (X axis) for different subjects (Y axis). (B) Frequency representation of the same CNV. (C) Matrix-based representation of the CNV along with the phenotype of the different subjects. (D) Representation of the CNV association results.
Figure 5
Figure 5
QQ-plots investigation. From a real dataset: copy number predictions for more than 3,600 individuals at 95,770 probes from chromosome 1; association was tested with either a simulated phenotype (A–C) or a real phenotype (D). The simulated phenotype corresponds to normally distributed data influenced by a confounding factor [here the first principal component (PC1) obtained from the matrix of copy number predictions]. (A) Shows a strong p-value inflation (lambda∼65) that is due to the confounding factor (PC1). (B) Corresponds to results from a model where PC1 is added as a covariate (to adjust for the confounding effect). Yet (B) shows a slight p-value deflation (lambda ∼0.87). This deflation is due to the fact that the tested probes are assumed to be independent while many of these probes correspond to a same CNV region (thus the presented p-values are not from truly independent tests). (C) Shows a QQ plot adjusting for PC1 and where P0 (the X axis) accounts for the fact that probes can come from the same CNV region. Such plot can be done (in the R programing language) by setting the vector of expected p-value (X axis) as P0 < −seq[1/N,1,by = (1 − 1/N)/(n − 1)] where N is the number of CNV regions (number of effective tests) and n is the total number of CNV probes (number of observations). (D) Shows results from association with real data (here body mass index). In these QQ-plots, points with identical p-values correspond to rare, but rather long CNVs that produce multiple identical probes.
Figure 6
Figure 6
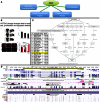
Possible strategies for CNV prioritization. (A) Overview of possible strategies. (B) Functional investigation in animal models (functional impact assessment). (C) Genes ranking based on text-mining approaches (prioritization). (D) Visualization in genome browser (genomic characterization).

References

    1. Adzhubei I. A., Schmidt S., Peshkin L., Ramensky V. E., Gerasimova A., Bork P., et al. (2010). A method and server for predicting damaging missense mutations. Nat. Methods 7, 248–24910.1038/nmeth0410-248 - DOI - PMC - PubMed
    1. Alkan C., Kidd J. M., Marques-Bonet T., Aksay G., Antonacci F., Hormozdiari F., et al. (2009). Personalized copy number and segmental duplication maps using next-generation sequencing. Nat. Genet. 41, 1061–106710.1038/ng.437 - DOI - PMC - PubMed
    1. Asimit J., Zeggini E. (2010). Rare variant association analysis methods for complex traits. Annu. Rev. Genet. 44, 293–30810.1146/annurev-genet-102209-163421 - DOI - PubMed
    1. Asimit J. L., Day-Williams A. G., Morris A. P., Zeggini E. (2012). ARIEL and AMELIA: testing for an accumulation of rare variants using next-generation sequencing data. Hum. Hered. 73, 84–9410.1159/000336982 - DOI - PMC - PubMed
    1. Attiyeh E. F., Diskin S. J., Attiyeh M. A., Mossé Y. P., Hou C., Jackson E. M., et al. (2009). Genomic copy number determination in cancer cells from single nucleotide polymorphism microarrays based on quantitative genotyping corrected for aneuploidy. Genome Res. 19, 276–28310.1101/gr.075671.107 - DOI - PMC - PubMed