Review
. 2013 Jun;5(3):301-16.
doi: 10.2217/epi.13.26.

DNA methylation data analysis and its application to cancer research

Affiliations
Review

DNA methylation data analysis and its application to cancer research

Xiaotu Ma et al. Epigenomics. 2013 Jun.

Abstract

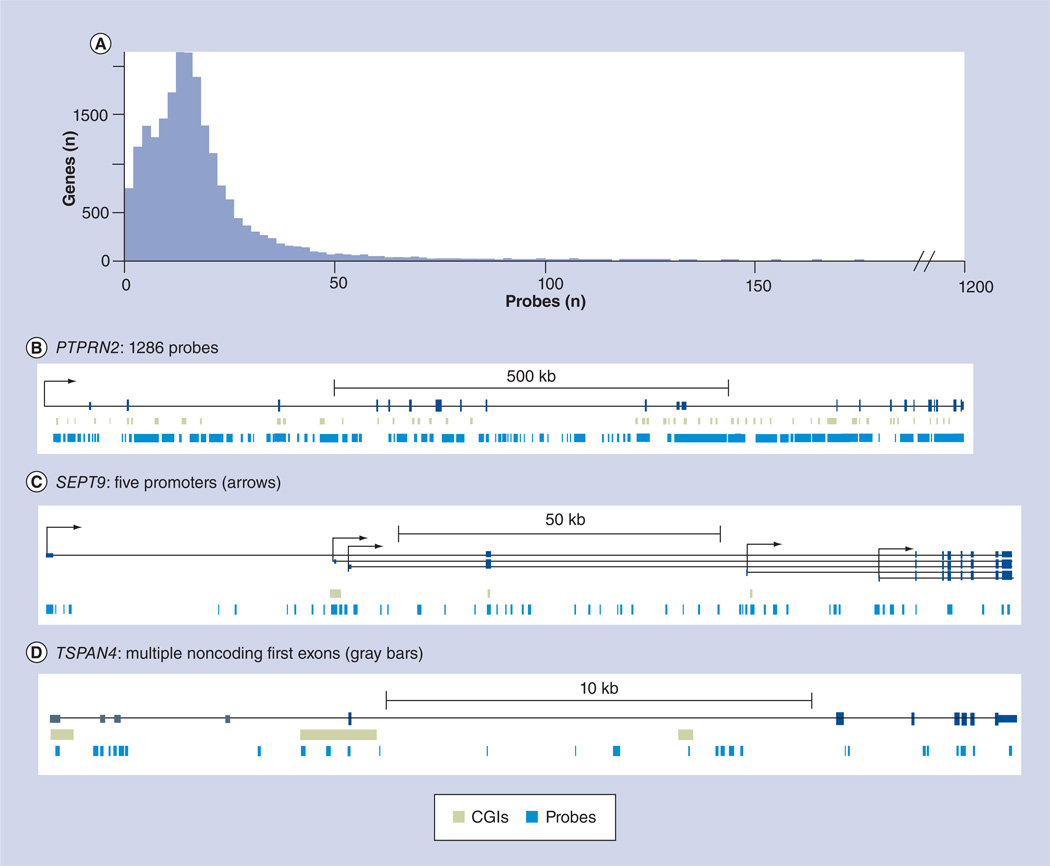
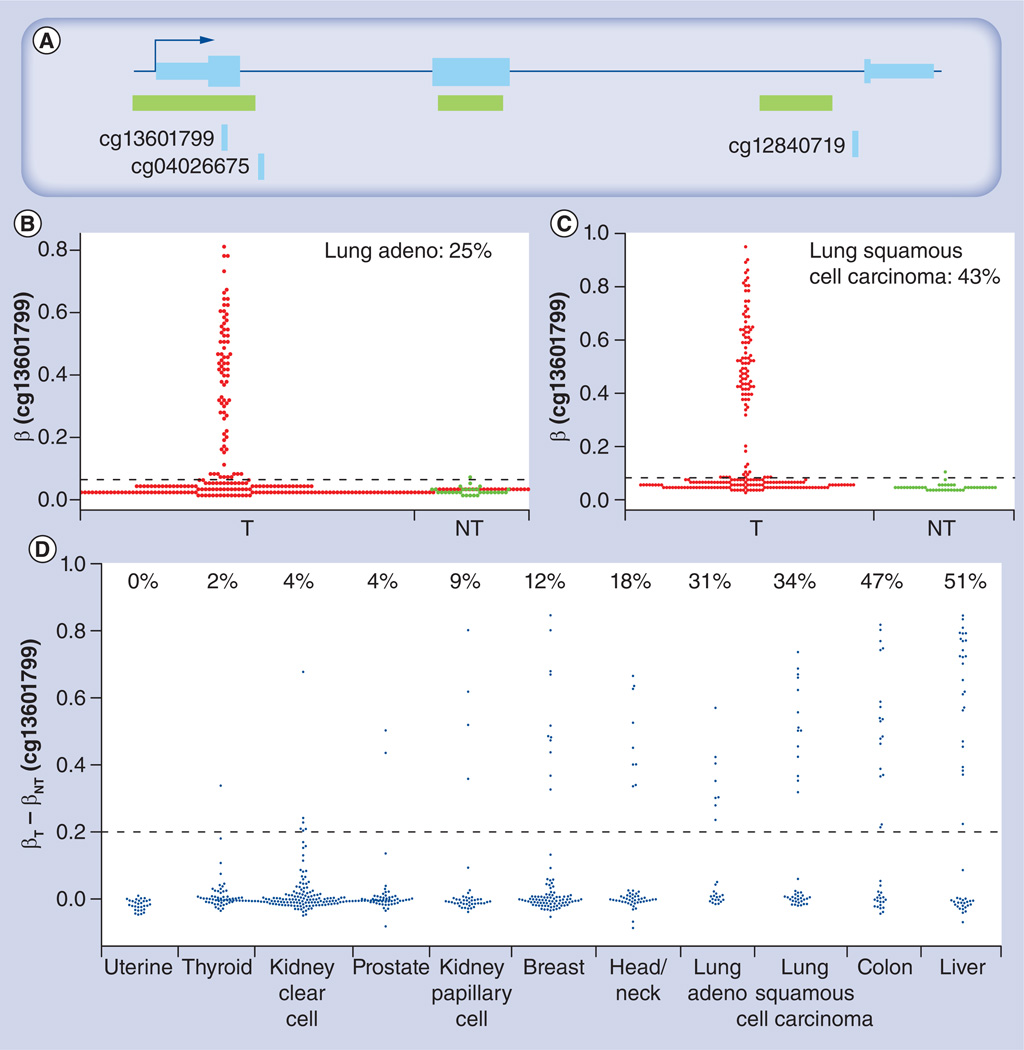
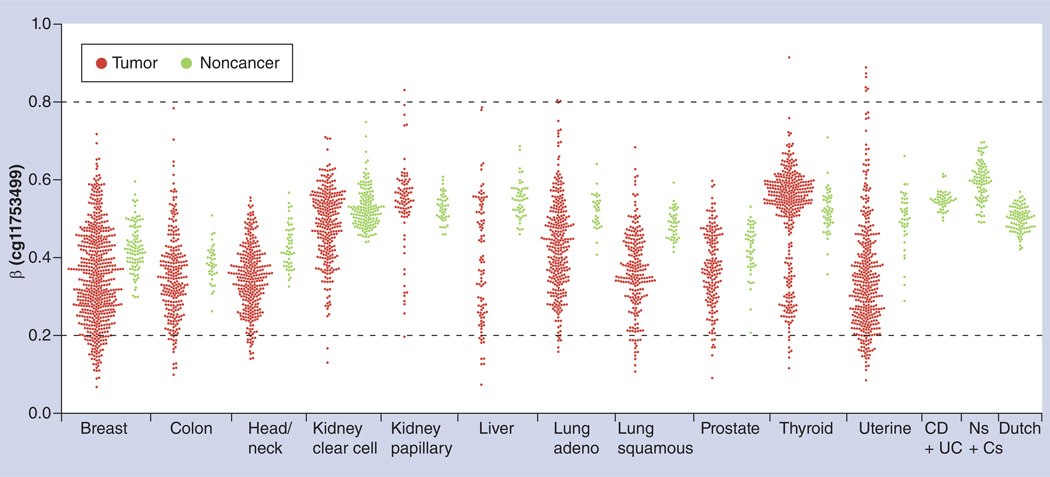
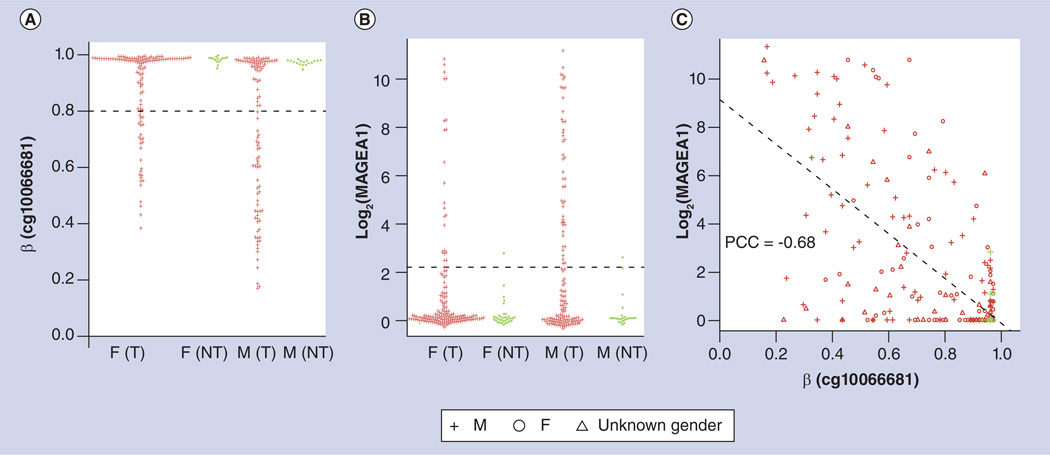
With the rapid development of genome-wide high-throughput technologies, including expression arrays, SNP arrays and next-generation sequencing platforms, enormous amounts of molecular data have been generated and deposited in the public domain. The application of computational approaches is required to yield biological insights from this enormous, ever-growing resource. A particularly interesting subset of these resources is related to epigenetic regulation, with DNA methylation being the most abundant data type. In this paper, we will focus on the analysis of DNA methylation data and its application to cancer studies. We first briefly review the molecular techniques that generate such data, much of which has been obtained with the use of the most recent version of Infinium HumanMethylation450 BeadChip(®) technology (Illumina, CA, USA). We describe the coverage of the methylome by this technique. Several examples of data mining are provided. However, it should be understood that reliance on a single aspect of epigenetics has its limitations. In the not too distant future, these defects may be rectified, providing scientists with previously unavailable opportunities to explore in detail the role of epigenetics in cancer and other disease states.


Conflict of interest statement

Financial & competing interests disclosure

The authors have no other relevant affiliations or financial involvement with any organization or entity with a financial interest in or financial conflict with the subject matter or materials discussed in the manuscript apart from those disclosed.

No writing assistance was utilized in the production of this manuscript.

Figures

Figure 1
Figure 1. The steady increase of deposited samples utilizing the Infinium HumanMethylation450 BeadChip® (lllumina, CA, USA)
These samples are made publicly available in the Gene Expression Omnibus database of the NCBI, which hosts both array- and sequence-based data, in addition to its software tool services. 450k array: Infinium HumanMethylation450 BeadChip array; NCBI: National Center for Biotechnology Information.
Figure 2
Figure 2. Global methylation patterns in blood samples from a Dutch population
CpG sites are categorized into (A) all CpG loci, (B) CGI, (C) CGI shores, (D) CGI shelves and (E) open sea. The number of CpG sites (y-axis) is shown as a function of the methylation level (β; x-axis). Also listed are percentages of hypomethylated (0–0.2; dashed vertical line to the left of each panel) and hypermethylated (0.8–1; dashed vertical line to the right of each panel) CpGs in each category. Dashed curves indicate the sample standard deviation. β: Methylation level; CGI: CpG island. Data taken from [49].
Figure 3
Figure 3. Example of genes with both positive and negative correlations between the promoter and gene body methylation levels and expression levels
The correlations between promoter and gene body methylation levels (β; x-axis) and expression levels (log2 [mRNA] of RNA-seq, quantile-normalized across samples; y-axis) are shown. (A) Expression level of the gene TSPYL5 is negatively correlated with its promoter methylation level (indicated by TSS probe cg00032205) in data from lung adenocarcinoma patients. (B) Expression level of the gene GRIK2 is positively correlated with its promoter methylation (indicated by TSS probe cg22541254) in data from lung squamous cell carcinoma patients. (C) Expression level of the gene LHX2 is positively correlated with its body methylation (indicated by probe cg12002589) in data from lung squamous cell carcinoma patients. (D) Expression level of the gene TXNRD1 is negatively correlated with its body methylation (indicated by probe cg 15647029) in data from lung squamous cell carcinoma patients. β: Methylation level; PCC: Pearson’s correlation coeffecient; TSS: Transcription start site. Data taken from The Cancer Genome Atlas [108].
Figure 4
Figure 4. Distribution of Infinium HumanMethylation450 BeadChip® (lllumina, CA, USA) array probes
Probes that can be uniquely associated to gene regions, including the promoter (transcription start sites 1500 and 200, 5´ UTR, and first exon), gene body, 3´ UTR and intergenic regions are summarized for CpG island, shore, shelf and open sea. 450k array: Infinium HumanMethylation450 BeadChip array.
Figure 5
Figure 5. Gene coverage by Infinium HumanMethylation450 BeadChip® (lllumina, CA, USA) probes
(A) Infinium HumanMethylation450 BeadChip coverage at gene level for 21,231 covered genes. Shown on the y-axis is the number of genes as a function of the number of targeting probes shown on the x-axis. (B) PTPRN2 has over 1000 probes. (C) SEPT9 has five promoters; some methylation probes targeting the second, third, fourth and fifth promoters can be regarded as body probes for the first promoter. (D) TSPAN4 has four noncoding 5´ UTR exons; the methylation probes targeting second, third and fourth exons may be regarded as body probes. CGI: CpG island.
Figure 6
Figure 6. Methylation pattern of the CDKN2A gene
(A) Gene structure and Infinium HumanMethylation450 BeadChip® (lllumina, CA, USA) probes for the CDKN2A promoter, where the CpG island overlapping the first exon (indicated by the arrow) is targeted by probe cg13601799. The methylation pattern of the CDKN2A promoter in T and NT samples is shown (B) for lung adeno and (C) lung squamous cell carcinoma, where the percentage of T samples with a methylation level higher than threshold (dashed line) determined using mean + (3 × standard deviation of the methylation level in noncancer samples) is indicated. (D) Elevated methylation level of CDKN2A promoter is seen in matched sample pairs for many cancers. Percentage of tumors with a methylation level increase over 0.2 (dashed line) is indicated. β: Methylation level; Adeno: Adenocarcinoma; NT: Non-malignant; T: Tumor.
Figure 7
Figure 7. Methylation level of imprinted gene H19 (promoter probe cg11753499)
Methylation of H19 is intermediate across cancers, regardless of tumor or noncancer samples from cancer patients. H19 methylation is also intermediate in cancer-free samples, including common inflammatory bowel diseases (CD + UC) [47], blood from Ns + Cs [48], as well as in schizophrenia patients and healthy subjects of Dutch descent (pooled together since there is no appreciable difference; Dutch [49]). Note the larger spread of methylation levels in tumor samples. β: Methylation level; Adeno: Adenocarcinoma; C: Centenarian; CD: Crohn′s disease; N: Newborn; UC: Ulcerative colitis.
Figure 8
Figure 8. Methylation and expression pattern of MAGEA1 on chromosome Xq28
(A) The promoter region of MAGEA1, as represented by probe cg10066681, is hypermethylated in NT lung tissue, while it is not methylated in some (23% female and 48% male) lung adenocarcinoma tumors. Dashed line: hypermethylation threshold of 0.8. (B) MAGEA1 has a very low expression level in NT lung tissues from lung adenocarcinoma cancer patients, while elevated expression occurs in some (14% female and 36% male) lung adenocarcinoma tumors. Dashed line: elevated expression threshold determined using mean + (3 × standard deviation in NT lung tissues from both female and male patients). (C) Promoter methylation level is highly correlated (PCC = −0.68; R2 = 0.46; p < e−16) with expression level in lung adenocarcinoma tumors for MAGEA1, confirming that tumor expression results from loss of methylation. β: Methylation level; F: Female; M: Male; NT: Non-malignant; PCC: Pearson correlation coefficient; T: Tumor.
Figure 9
Figure 9. Methylation and expression patterns of the UTX gene, which is not subject to X chromosome inactivation
The UTX promoter is not methylated, regardless of gender, tumor status for (A) lung adenocarcinoma, (B) lung squamous cell carcinoma an (C) kidney renal clear cell carcinoma. By contrast, expression levels of UTX are higher in females than in males, regardless of tumor or nontumor status for both (D) lung adenocarcinoma, (E) lung squamous cell carcinoma and (F) kidney renal clear cell carcinoma where fold change is between 1.3 and 1.7. F: Female; M: Male; NT: Non-malignant; T: Tumor.
Figure 10
Figure 10. Classification of lung squamous cell carcinoma and lung adenocarcinoma tumors using methylome data
The top 100 Infinium HumanMethylation450 BeadChip® (lllumina, CA, USA) array autosomal probes with highest variances across tumors from both lung squamous cell carcinoma and lung adenocarcinoma patients are used to perform hierarchical clustering based on their β-values. β: Methylation level.

References

    1. Schena M, Shalon D, Davis RW, Brown PO. Quantitative monitoring of gene expression patterns with a complementary DNA microarray. Science. 1995;270(5235):467–470. - PubMed
    1. Ren B, Robert F, Wyrick JJ, et al. Genome-wide location and function of DNA binding proteins. Science. 2000;290(5500):2306–2309. - PubMed
    1. Wang DG, Fan JB, Siao CJ, et al. Large-scale identification, mapping, and genotyping of single-nucleotide polymorphisms in the human genome. Science. 1998;280(5366):1077–1082. - PubMed
    1. Bibikova M, Barnes B, Tsan C, et al. High density DNA methylation array with single CpG site resolution. Genomics. 2011;98(4):288–295. - PubMed
    1. Laird PW. Principles challenges of genomewide DNA methylation analysis. Nat. Rev. Genet. 2010;11(3):191–203.▪▪ Excellent review of DNA methylation measurements and analysis.

Websites

    1. Nature. Nature ENCODE explorer. www.nature.com/encode.
    1. ENCODE Data Coordination Center at UCSC. ENCODE common cell types. http://genome.ucsc.edu/ENCODE/cellTypes.html.
    1. NIH Roadmap Epigenomics Project. www.roadmapepigenomics.org.
    1. NIH working definition of bioinformatics and computational biology. www.bisti.nih.gov/docs/CompuBioDef.pdf.
    1. National Center for Biotechnology Information. RefSeq: NCBI Reference Sequence Database. www.ncbi.nlm.nih.gov/RefSeq/

Publication types

Substances

LinkOut - more resources