. 2013 Jun 10;201(6):887-901.
doi: 10.1083/jcb.201211159.

Dynamic microtubules produce an asymmetric E-cadherin-Bazooka complex to maintain segment boundaries

Affiliations

Dynamic microtubules produce an asymmetric E-cadherin-Bazooka complex to maintain segment boundaries

Natalia A Bulgakova et al. J Cell Biol. .

Abstract

Distributing junctional components around the cell periphery is key for epithelial tissue morphogenesis and homeostasis. We discovered that positioning of dynamic microtubules controls the asymmetric accumulation of E-cadherin. Microtubules are oriented preferentially along the dorso-ventral axis in Drosophila melanogaster embryonic epidermal cells, and thus more frequently contact E-cadherin at dorso-ventral cell-cell borders. This inhibits RhoGEF2, reducing membrane recruitment of Rho-kinase, and increasing a specific E-cadherin pool that is mobile when assayed by fluorescence recovery after photobleaching. This mobile E-cadherin is complexed with Bazooka/Par-3, which in turn is required for normal levels of mobile E-cadherin. Mobile E-cadherin-Bazooka prevents formation of multicellular rosette structures and cell motility across the segment border in Drosophila embryos. Altogether, the combined action of dynamic microtubules and Rho signaling determines the level and asymmetric distribution of a mobile E-cadherin-Bazooka complex, which regulates cell behavior during the generation of a patterned epithelium.


Figures
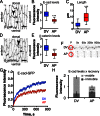
Figure 1.
Figure 1.
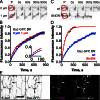
Mobile E-cad is asymmetrically distributed in epidermal cells. (A–E) There are two junction types in the lateral epidermis of stage 15 embryos: short DV borders (DV, arrowhead in A and D) and long AP borders (AP; arrow in A and D). DV borders have higher junctional E-cad (A and B, anti–E-cad) and β-catenin levels (D and E, anti–β-catenin), and are shorter (C) than AP. Bars, 5 µm. (F and G) There is greater exchange of E-cad–GFP at DV borders than AP, shown by greater FRAP; single FRAP examples (F), with red circles on the prebleached frame (P) showing the bleach spots, and averaged recovery curves (mean ± SEM) plotted in G, with best fit curves as solid lines. (H) Combining the measurements of E-cad junctional levels and E-cad–GFP recovery provides estimates of mobile and immobile pools of E-cad at DV and AP borders (error bars indicate mean ± SEM), showing that DV borders have more mobile E-cad. Table S1 has detailed numbers for this and all other figures. *, P < 0.01; **, P < 0.001; ***, P < 0.0001.
Figure 2.
Figure 2.
Mechanisms of E-cad recovery. (A and B) Localization of Echinoid-YFP (A; Ed, black/green in epidermal cells) and quantification (B) of Ed junctional levels in cells expressing EB1-DN (magenta in A) and adjacent wild-type cells. Bar, 5 µm. (C–H) E-cad–GFP FRAP recovery at DV borders: (C–D) comparing 1-µm and 2-µm bleach spots with the inset in D showing a closer view of the initial recovery to highlight the difference; (E and F) with ShiDN versus wild type; and (G and H) comparing the first and second bleach of the same spot. Examples of recovery are shown in C, E, and G, with red circles on the prebleached frame (P) showing the bleach spots, and averaged recovery curves (error bars indicate mean ± SEM) with best fit curves shown as solid lines in D, F, and H. The first frame after the first bleach event (B) and the prebleach frame before the second bleach event (S) are shown in G.
Figure 3.
Figure 3.
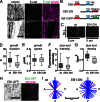
Baz binds E-cad and is required for normal junctional levels of mobile E-cad. (A) E-cad and Baz colocalize at junctions as scored by antibody staining of endogenous proteins. (B) Endogenous E-cad and α-catenin (α-cat), but not EB1-GFP, coimmunoprecipitate with Baz. Input lane shows 5% of immunoprecipitation volume. (C–F) Baz (C; black/green, anti-Baz) and E-cad (D; black/green, anti–E-cad) in wild-type cells and adjacent cells expressing baz-RNAi (magenta) or CD8 as control (not depicted), and quantitation of levels (E and F). Bars, 5 µm. (G–J) E-cad–GFP FRAP in cells expressing baz-RNAi at DV (G and H) and AP borders (I and J). Examples of recovery are shown in G and I, with red circles on the prebleached frame (P) showing the bleach spots, and averaged recovery curves (error bars indicate mean ± SEM) with best fit curves shown as solid lines in H and J. See Fig. S1 for a similar experiment with β-catenin RNAi. (K) Combining the data permits an estimate of mobile and immobile E-cad pools (error bars indicate mean ± SEM) at DV and AP borders. ***, P < 0.0001.
Figure 4.
Figure 4.
Mechanisms of Baz recovery. (A–D) Baz-GFP FRAP at DV borders. Baz-GFP recovery is via diffusion and trafficking, similar to E-cad–GFP: comparing 1-µm and 2-µm bleach spots with the inset in B showing a closer view of the initial recovery to highlight the difference (A and B), and in cells expressing ShiDN (C and D). Examples of recovery are shown in A and C, with red circles on the prebleached frame (P) showing the bleach spots, and averaged recovery curves (error bars indicate mean ± SEM) with best fit curves shown as solid lines in B and D. (E) E-cad and Baz-GFP colocalized in tubular structures (arrows) caused by expression of Shi-DN. Colocalization is shown in white in right image. Bar, 5 µm.
Figure 5.
Figure 5.
EB1-DN and Spas change MT organization and dynamics. (A) Spas eliminated MTs in epidermal cells at the level of E-cad junctions (wild type [wt], Spas expressed in a stripe of two cells; α-tubulin, magenta; E-cad, green). (B) EB1 domains, showing MT-binding CH, coil-coiled (CC) dimerization, and acidic C terminus (Ac) are depicted, as well as new constructs with GFP and Cherry tags. (C) Sample kymographs showing growth of individual MTs in wild-type (wt) and EB1-DN cells. (D–G) EB1-DN reduced processivity of MT growth and the number of growing ends. Quantitation of individual growth event duration (D), MT growth speed (E), EB1-GFP fluorescence intensity at individual plus ends (F), and plus end density per square micrometer at the level of E-cad junctions (G). (H and I) EB1-DN changed oriented growth of MTs. (H) Projection of 20 images taken every 0.5 s. EB1-GFP, black/green; EB1-DN, magenta. (I) Quantitation of growth orientation of individual MTs in control and EB1-DN cells (Cherry-positive in H) relative to dorsal (D), ventral (V), anterior (A), and posterior (P) sides of the embryos. Red lines mark 45° segments. Bars, 5 µm. ***, P < 0.0001.
Figure 6.
Figure 6.
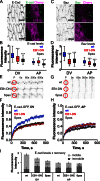
EB1-DN and Spas reduce mobile E-cad–Baz and its asymmetry. (A–D) Endogenous E-cad (A) and Baz (C) localization in cells expressing EB1-DN or Spas (anti–E-cad, black/green in A; anti-Baz, black/green in C; Cherry-tagged products in experimental cells, magenta), and quantitation of E-cad (B) and Baz (D) levels at the junctions. Bars, 5 µm. (E–H) Recovery of E-cad–GFP in cells that express CD8, EB1-DN, or Spas at DV borders (E and F) and AP borders (G and H). Examples of recovery are shown in E and G, with red circles on the prebleached frame (P) showing the bleach spots, and averaged recovery curves (error bars indicate mean ± SEM) in F and H. wt, wild-type cells adjacent to experimental. (G) Combining this data provides an estimate of mobile and immobile E-cad pools (mean ± SEM); inhibition of MTs especially reduced the mobile E-cad at DV borders. Fig. S2 shows the same defect in Eb1 mutant embryos. **, P < 0.001; ***, P < 0.0001.
Figure 7.
Figure 7.
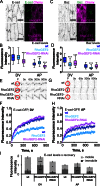
RhoGEF2 negatively regulates mobile E-cad–Baz. (A–D) Endogenous E-cad (A; black/green, anti–E-cad) and Baz (C; black/green, anti-Baz) localization in wild type and upon RhoGEF2 overexpression or down-regulation with RhoGEF2-RNAi (A and C; magenta), and quantitation of E-cad (B) and Baz (D) junctional levels. Bars, 5 µm. (E–H) E-cad–GFP FRAP upon RhoGEF2 overexpression or down-regulation with RhoGEF2-RNAi at DV (E and F) and AP borders (G and H). Examples of recovery are shown in E and G, with red circles on the prebleached frame (P) showing the bleach spots, and averaged recovery curves (error bars indicate mean ± SEM) in F and H. (I) Combining this data provides an estimate of mobile and immobile E-cad pools (error bars indicate mean ± SEM) at DV and AP borders. *, P < 0.01; **, P < 0.001; ***, P < 0.0001.
Figure 8.
Figure 8.
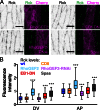
Rok localization is regulated positively by RhoGEF2 and negatively by MTs. Rok-YFP localization (A; black/green) in wild-type (wt) and adjacent cells expressing RhoGEF2, RhoGEF2-RNAi, EB1-DN, or Spas marked with Cherry (magenta), and quantitation of Rok-YFP junctional levels (B). Bar, 5 µm. ***, P < 0.0001.
Figure 9.
Figure 9.
Mobile E-cad–Baz prevents cells from crossing the segment boundary. (A) Examples of stripes of en::Gal4 driving GFP (red), with cell outlines labeled with anti–E-cad (green). In most cases, cells do not cross the segment boundary (white line, left). When cells cross, one can see independent events with different levels of GFP (middle, arrowheads), a rare example of a cell pair in the process of crossing the boundary (right, arrow). Bars, 5 µm. (B) Quantitation of cell behavior in control cells and cells expressing CD8, EB1-DN, Spas, or baz-RNAi. (top) Percentage of stripes with cells expressing the engrailed-driven marker transgene on the other side of the segment boundary; (middle) relative rates of cell pair crossing, estimated using Poisson distribution; (bottom) percentage of rosettes, five- and six-cell contacts, between cells within the posterior compartment (the cells at the boundary and their anterior neighbors). In each case, the mean ± 95% CI is shown (error bars); for raw data and examples of fitting with Poisson distribution, see Fig. S3. (C) Examples of three-cell contact (3), four-cell contact (4), and five-cell contact rosette (R) between cells at the segment border and their anterior neighbors, indicated with asterisks in A. (D) Localization of MyoII-YFP (black/green) in wild-type cells and adjacent cells expressing CD8, EB1-DN, Spas, or baz-RNAi marked with Cherry (magenta). Bars, 5 µm. (E) Quantitation of cortical MyoII levels, see also Table S1. *, P < 0.01; **, P < 0.001; ***, P < 0.0001.
Figure 10.
Figure 10.
Models. (A) Model of regulation of mobile E-cad distribution by dynamic MTs. EB1 at MT plus ends sequesters RhoGEF2, suppressing Rok localization at DV borders. This releases inhibition of mobile E-cad–Baz, elevating it at DV borders. (B) Model of formation of a five-cell rosette (right, arrowhead) from four-cell contact (left) through either “unzipping” of the DV border (red, arrow) and reattachment with the AP border (red/black) or membrane internalization (red, arrows). (C) Model of cell crossing of the segment border through rosette resolution (blue asterisks). The collapsing junctions are in red, the newly formed junctions are in blue, and those changing from AP to DV are in yellow.

References

    1. Akhmanova A., Steinmetz M.O. 2008. Tracking the ends: a dynamic protein network controls the fate of microtubule tips. Nat. Rev. Mol. Cell Biol. 9:309–322 10.1038/nrm2369 - DOI - PubMed
    1. Akhmanova A., Yap A.S. 2008. Organizing junctions at the cell-cell interface. Cell. 135:791–793 10.1016/j.cell.2008.11.002 - DOI - PubMed
    1. Akhmanova A., Stehbens S.J., Yap A.S. 2009. Touch, grasp, deliver and control: functional cross-talk between microtubules and cell adhesions. Traffic. 10:268–274 10.1111/j.1600-0854.2008.00869.x - DOI - PubMed
    1. Bieling P., Laan L., Schek H., Munteanu E.L., Sandblad L., Dogterom M., Brunner D., Surrey T. 2007. Reconstitution of a microtubule plus-end tracking system in vitro. Nature. 450:1100–1105 10.1038/nature06386 - DOI - PubMed
    1. Blankenship J.T., Backovic S.T., Sanny J.S.P., Weitz O., Zallen J.A. 2006. Multicellular rosette formation links planar cell polarity to tissue morphogenesis. Dev. Cell. 11:459–470 10.1016/j.devcel.2006.09.007 - DOI - PubMed

Publication types

MeSH terms