. 2013 Sep 28;338(2):292-9.
doi: 10.1016/j.canlet.2013.05.036. Epub 2013 Jun 7.

The natural product honokiol inhibits calcineurin inhibitor-induced and Ras-mediated tumor promoting pathways

Affiliations

The natural product honokiol inhibits calcineurin inhibitor-induced and Ras-mediated tumor promoting pathways

Pallavi Banerjee et al. Cancer Lett. .

Abstract

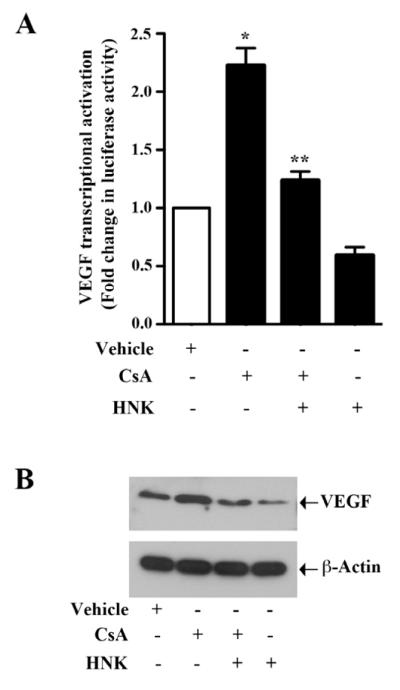
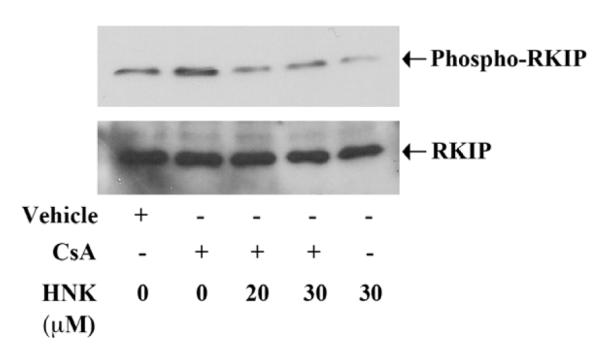
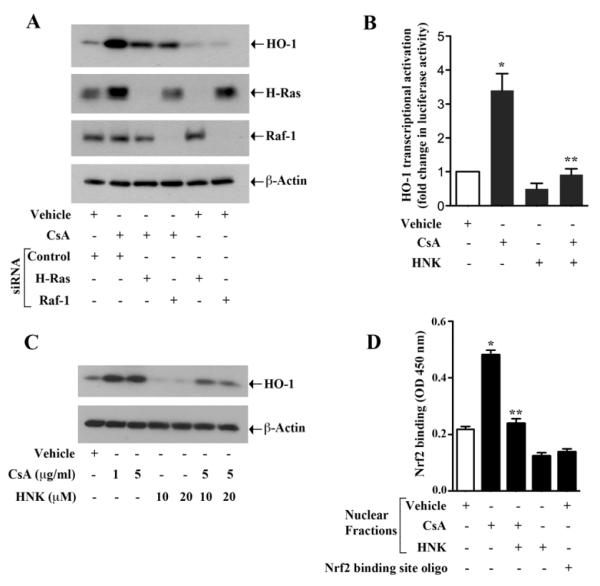
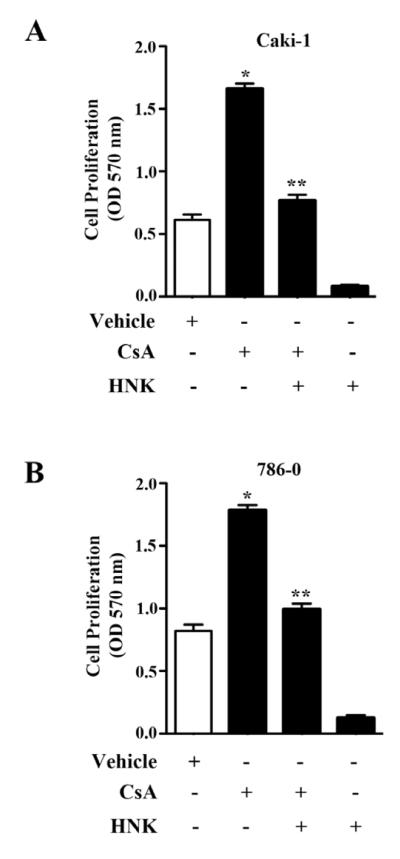
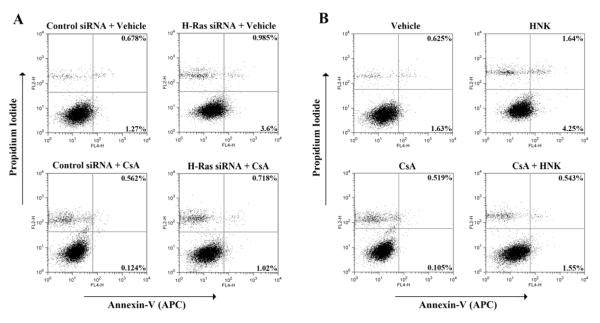
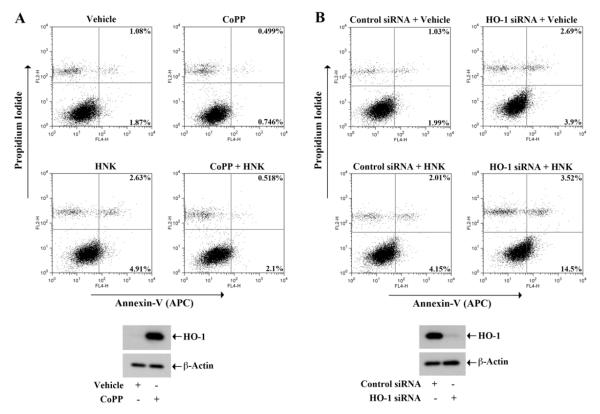
Although calcineurin inhibitors (CNIs) are very useful in preventing allograft rejection, they can mediate a rapid progression of post-transplantation malignancies. The CNI cyclosporine A (CsA) can promote renal tumor growth through activation of the proto-oncogene ras and over-expression of the angiogenic cytokine VEGF; the ras activation also induces over-expression of the cytoprotective enzyme HO-1, which promotes survival of renal cancer cells. Here, we show that the natural product honokiol significantly inhibited CsA-induced and Ras-mediated survival of renal cancer cells through the down-regulations of VEGF and HO-1. Thus, honokiol treatment may help to prevent tumor-promoting effects of CsA in transplant patients.

Keywords: HO-1; Honokiol; Ras; Renal tumor; VEGF.


Figures

FIGURE 1
FIGURE 1. Honokiol inhibits CsA-induced promoter activity and over-expression of VEGF
(a) 786-O cells were transfected with VEGF promoter-luciferase construct (0.5 μg) and treated with 5 μg/ml CsA, 20 μM honokiol (HNK) or vehicle. The cells were harvested 48 h after transfection and fold change in luciferase activity was calculated as the relative luciferase counts from each group of cells compared to that of vehicle-treated control. Results are representative of three independent experiments. Columns, average of triplicate readings from two different samples; error bars, standard error of the mean (SEM). * p < 0.05. compared with vehicle-treated control, and ** p < 0.05 compared with CsA-treated but HNK-untreated cells. (b) 786-O cells were treated with 5 μg/ml CsA, 20 μM HNK or vehicle for 48 h. The cells were lysed and the expression of VEGF was analyzed by western blot (top). β-actin was used as loading control (bottom). Results are representative of three independent experiments.
FIGURE 2
FIGURE 2. Honokiol reduces CsA-induced phosphorylation of RKIP
786-O cells were treated with different combinations of 5 μg/ml CsA, 20-30 μM honokiol (HNK) or vehicle alone for 6 h. The cells were lysed and the expression of phospho-RKIP and RKIP was analyzed by Western blot. Data shown are representative of three independent experiments.
FIGURE 3
FIGURE 3. CsA-induced and Ras-mediated over-expression of HO-1 is inhibited by honokiol
(a) Caki-1 cells were transfected with H-Ras siRNA (25 nM), Raf-1 siRNA (25 nM) or control siRNA. After 48 h of siRNA transfection, the cells were treated with 5 μg/ml CsA or vehicle for 24 h. The cells were lysed and the expression of HO-1, H-Ras, Raf-1 and β-actin was analyzed by Western blot. Data shown are representative of three independent experiments. (b) 786-O cells were transfected with HO-1 promoter-luciferase construct (0.5 μg), and then treated with 5 μg/ml CsA, 20 μM honokiol (HNK) or vehicle. The cells were harvested 48 h after transfection and fold change in luciferase activity was calculated as the relative luciferase counts from each group of cells compared to that of vehicle-treated control. Results are representative of three independent experiments. Columns, average of triplicate readings from two different samples; error bars, standard error of the mean (SEM). * p < 0.05. compared with vehicle-treated control, and ** p < 0.05 compared with CsA-treated but HNK-untreated cells. (c) Caki-1 cells were treated with different combinations of 1-5 μg/ml CsA, 10-20 μM honokiol (HNK) or vehicle for 24 h. The cells were lysed and the expression of HO-1 and β-actin was analyzed by Western blot. Data shown are representative of three independent experiments. (d) Caki-1 cells were treated with different combinations of 5 μg/ml CsA, 20 μM HNK or vehicle for 6 h. Nuclear fraction was isolated from the cells and DNA binding activity of Nrf2 present in the nuclear extract was analyzed using TransAM Nrf2 ELISA kit as described in the “Materials and Methods” section. Nrf2 consensus binding site oligo was used to compete Nrf2 binding in order to monitor specificity of the assay. Results are representative of three different experiments. Columns, average of triplicate readings from two different samples; error bars, SEM. * p < 0.05 compared with vehicle treated control, and ** p < 0.05 compared with CsA-treated but HNK-untreated cells.
FIGURE 4
FIGURE 4. Honokiol attenuates CsA-induced proliferation of renal cancer cells
(a) Caki-1 and (b) 786-O cells were treated with different combinations of 5 μg/ml CsA, 20 μM honokiol (HNK) or vehicle alone for 48 h. Cell proliferation was measured by MTT assay. Results are representative of three independent experiments. Columns, average of triplicate readings from three different samples; error bars, SEM. * p < 0.05 compared with vehicle treated control, and ** p < 0.05 compared with CsA-treated but HNK-untreated cells..
FIGURE 5
FIGURE 5. Honokiol inhibits CsA-induced and Ras-mediated survival of renal cancer cells
(a) Caki-1 cells were transfected with 50 nM H-Ras siRNA or control siRNA, and treated with 10 μg/ml CsA or vehicle for 72 h. (b) Caki-1 cells were treated with different combinations of 10 μg/ml CsA, 20 μM honokiol (HNK) or vehicle alone for 72 h. In (a) and (b), apoptotic index of the cells was determined by Annexin-V (APC) and propidium iodide staining. Data shown are representative of three independent experiments.
FIGURE 6
FIGURE 6. HO-1 modulates honokiol-induced apoptosis of renal cancer cells
(a) Caki-1 cells were treated with different combinations of 20 μM CoPP, 20 μM honokiol (HNK) or vehicle for 72 h. (b) Caki-1 cells were transfected with 50 nM HO-1 siRNA or control siRNA, and treated with 20 μM HNK or vehicle for 72 h. In A and B (top panel), apoptotic index of the cells was determined by Annexin-V (APC) and propidium iodide staining. The over-expression of HO-1 in CoPP-treated cells and the knockdown of HO-1 in siRNA-transfected cells was confirmed by Western blot (a and b, bottom panel). Data shown are representative of three independent experiments.

References

    1. Kasiske BL, Snyder JJ, Gilbertson DT, Wang C. Cancer after kidney transplantation in the United States. Am J Transplant. 2004;4:905–913. - PubMed
    1. Bustami RT, Ojo AO, Wolfe RA, Merion RM, Bennett WM, McDiarmid SV, Leichtman AB, Held PJ, Port FK. Immunosuppression and the risk of post-transplant malignancy among cadaveric first kidney transplant recipients. Am J Transplant. 2004;4:87–93. - PubMed
    1. Wimmer CD, Rentsch M, Crispin A, Illner WD, Arbogast H, Graeb C, Jauch KW, Guba M. The janus face of immunosuppression - de novo malignancy after renal transplantation: the experience of the Transplantation Center Munich. Kidney Int. 2007;71:1271–1278. - PubMed
    1. Hojo M, Morimoto T, Maluccio M, Asano T, Morimoto K, Lagman M, Shimbo T, Suthanthiran M. Cyclosporine induces cancer progression by a cell-autonomous mechanism. Nature. 1999;397:530–534. - PubMed
    1. Guba M, Graeb C, Jauch KW, Geissler EK. Pro- and anti-cancer effects of immunosuppressive agents used in organ transplantation. Transplantation. 2004;77:1777–1782. - PubMed

Publication types

MeSH terms