. 2014 May 15;33(20):2639-54.
doi: 10.1038/onc.2013.210. Epub 2013 Jun 10.

Utility of a bacterial infection model to study epithelial-mesenchymal transition, mesenchymal-epithelial transition or tumorigenesis

Affiliations

Utility of a bacterial infection model to study epithelial-mesenchymal transition, mesenchymal-epithelial transition or tumorigenesis

P Chandrakesan et al. Oncogene. .

Abstract

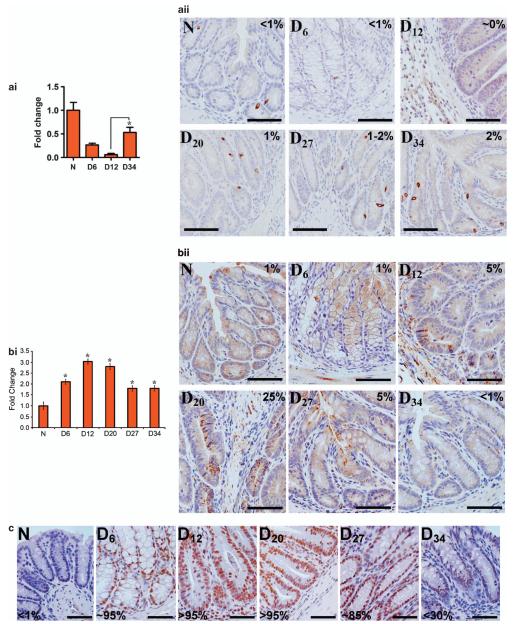
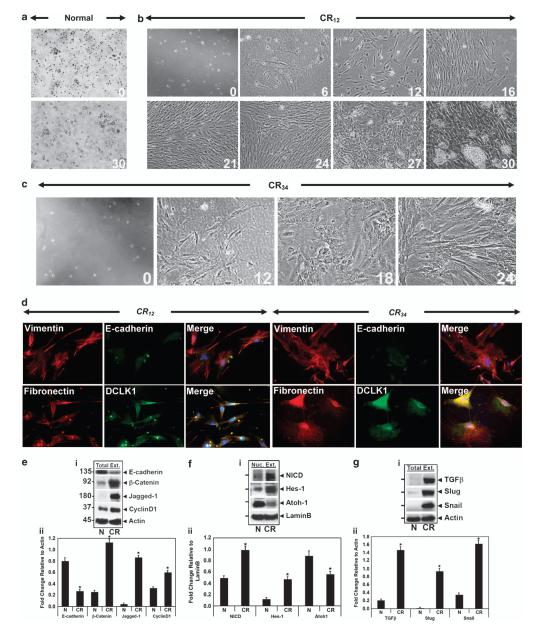
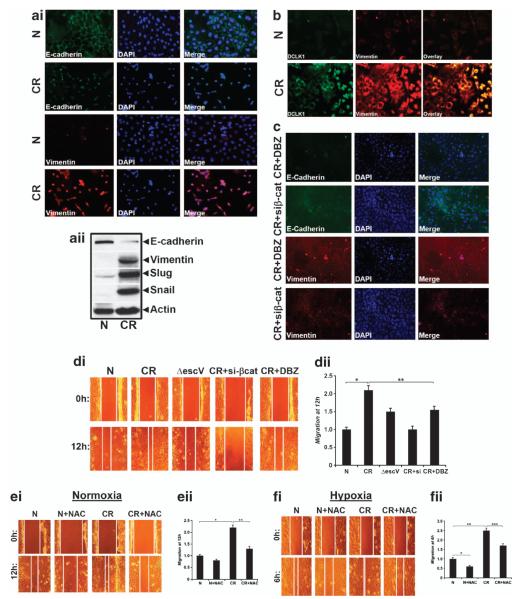
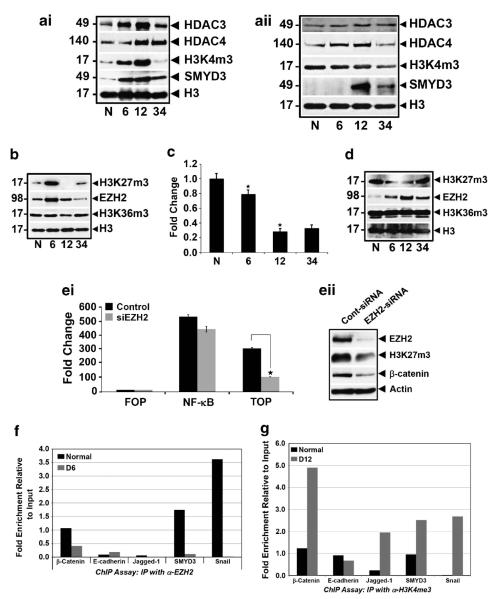
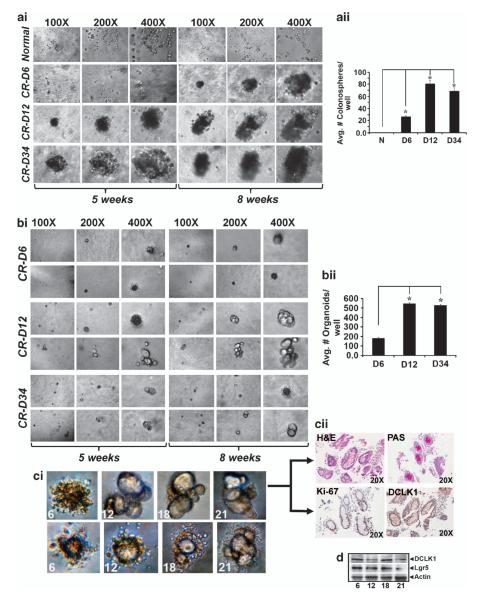
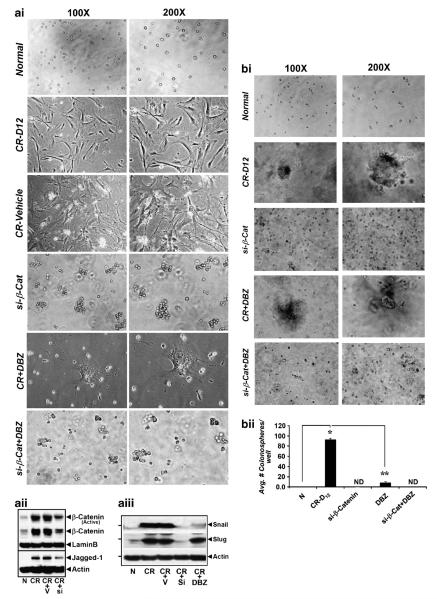
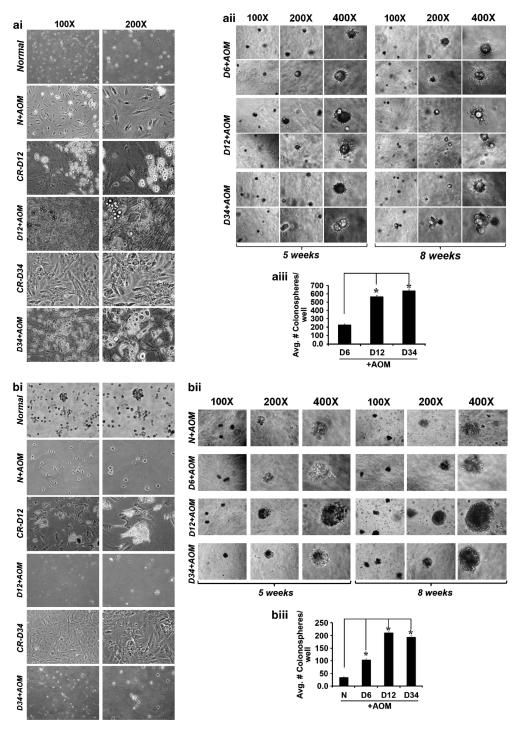
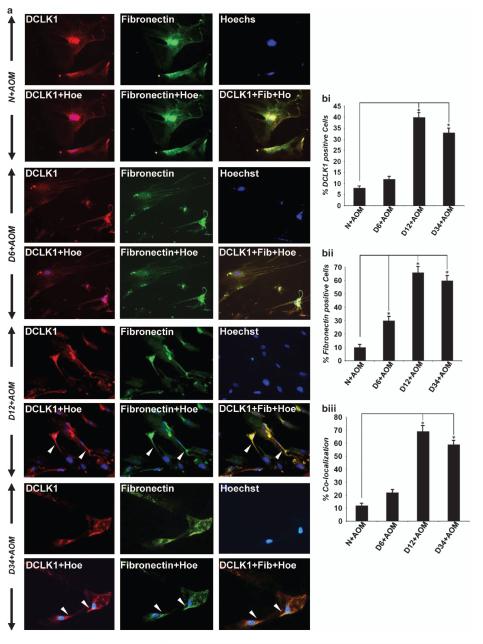
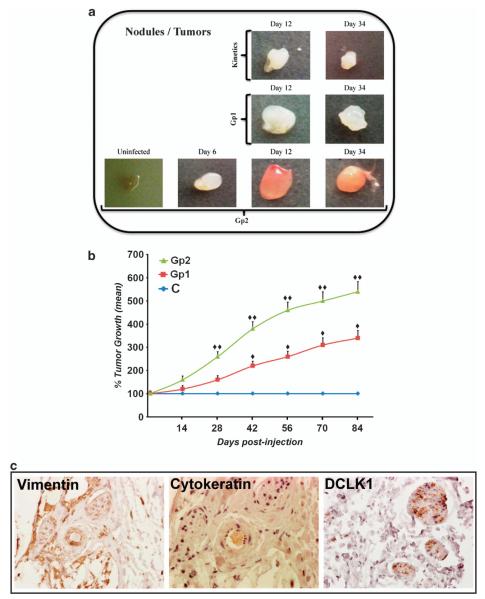
DCLK1 and Lgr5 have recently been identified as markers of quiescent and cycling stem cells in the small intestinal crypts, respectively. Epithelial-mesenchymal transition (EMT) is a key development program that is often activated during cancer invasion and metastasis, and also imparts a self-renewal capability to disseminating cancer cells. Utilizing the Citrobacter rodentium (CR)-induced transmissible murine colonic hyperplasia (TMCH) model, we observed a relative decrease in DCLK1 expression in the colonic crypts, with significant shift towards stromal staining at peak (12 days post infection) hyperplasia, whereas staining for Lgr5 and Msi-1 increased several fold. When hyperplasia was regressing (days 20-34), an expansion of DCLK1+ve cells in the CR-infected crypts compared with that seen in uninfected control was recorded. Purified colonic crypt cells exhibiting epigenetic modulation of the transforming growth factor-β (TGFβ), Wnt and Notch pathways on 12 or 34 days post infection formed monolayers in vitro, and underwent trans-differentiation into fibroblast-like cells that stained positive for vimentin, fibronectin and DCLK1. These cells when trypsinized and regrown in soft agar, formed colonospheres/organoids that developed into crypt-like structures (colonoids) in Matrigel and stained positive for DCLK1. Mice exhibiting 12 or 34 days of TMCH were given azoxymethane once for 8 h (Gp1) or weekly for 3 weeks (Gp2), and subjected to crypt isolation. Crypt cells from Gp1 animals formed monolayers as well as colonospheres in soft agar and nodules/tumors in nude mice. Crypt cells isolated from Gp2 animals failed to form the monolayers, but developed into colonospheres in soft agar and nodules/tumors in nude mice. Thus, both hyperplasia and increased presence of DCLK1+ve cells promote cellular transformation in response to a second hit. The TMCH model, therefore, provides an excellent template to study how alterations in intestinal stem cells promote trans-differentiation, crypt regeneration or colon carcinogenesis following bacterial infection.


Figures

Figure 1
Figure 1
Effect of CR infection on stem cell markers expression. (ai) Total RNA isolated from the distal colonic crypts of uninfected normal (N) or days 6, 12 and 34 post-CR-infected mice (D6-D34) was subjected to real-time PCR. Bar graph showing fold change in DCLK1 expression (*P<0.03 versus day 12; n = 3 independent experiments). (aii) Paraffin-embedded sections prepared from uninfected normal (N) and days 6–34 post-infected mouse distal colons were stained with antibody specific for DCLK1 and were analyzed via light microscopy. (Bar = 100 μm; n = 3 independent experiments). (bi) Real-time PCR analysis of total RNA isolated from colonic crypts of group of mice described in (ai). Bar graph showing fold change in Lgr5 expression (*P<0.05 versus uninfected control; n = 3 independent experiments). (bii and c) Paraffin-embedded sections prepared from uninfected normal (N) and days 6–34 post-infected mouse distal colons were stained with antibodies specific for Lgr5 and Msi-1, respectively (Bar = 100 μm; n = 3 independent experiments).
Figure 2
Figure 2
Culture of colonic crypt cells in vitro. (ac) Colonic crypt cells from uninfected normal (N) or 12 (CR12) and 34 (CR34) days post-infected mice were isolated and cultured for 0–30 days (N, CR12) or 0–24 days (CR34) in insulin/transferrin/selenium-supplemented DMEM. Evidence of EMT in cultured cells. Colonic crypt cells in culture were stained for vimentin and E-cadherin and fibronectin and DCLK1. (ei, fi, gi) Total and/or nuclear colonic crypt extracts from uninfected normal (N) or CR-infected mice (CR) were subjected to western blots with antibodies for indicated proteins. (eii, fii, gii) Representative bar graphs showing relative levels of indicated proteins following normalization with either actin or lamin B (*P<0.05 versus N; n = 3 independent experiments).
Figure 3
Figure 3
Evidence of CR infection-induced EMT in primary cells. (ai) Uninfected normal (N) YAMC cells were treated with control media or with CR (at 90:1 multiplicity of infection) for 3 h followed by washing to remove bacteria. At 24 h post infection, cells were stained with antibodies for E-cadherin and vimentin, whereas nuclei were stained with DAPI. (aii) Western blot showing relative levels of E-cadherin, vimentin, Slug and Snail in N and CR-infected cells. (b) Colocalization of vimentin with DCLK1. Uninfected (N) or CR-infected YAMC cells were stained with antibodies for DCLK1 and vimentin. Please note the significant colocalization of vimentin with DCLK1 in CR-infected cells. (c) Signaling via the Notch and Wnt/β-catenin pathways regulates EMT. CR-infected cells were treated with either Notch blocker DBZ (CR + DBZ) for 24 h or transfected with small interfering RNA (siRNA) to β-catenin (CR + siβ-cat) for 48 h followed by staining for E-cadherin and vimentin while nuclei were stained with DAPI. (di) Wound-healing assay. Uninfected (N) YAMC cells were infected with either wild-type CR or ΔescV mutant, whereas wild-type CR-infected cells were also transfected with siRNA to β-catenin or treated with DBZ followed by wound assay for 12 h. Please note that almost-complete inhibition of cell migration occured with β-catenin siRNA, whereas ΔescV and DBZ partially inhibited cell migration. (dii) Representative bar graph showing relative migration at 12 h compared with 0 h in indicated samples (*P<0.05 versus control; **P<0.05 versus CR; n = 3 3 independent experiments). (ei, fi) Effect of hypoxia on wound healing. Uninfected (N) or CR-infected YAMC cells under normoxic (5% CO2, 95% O2) or hypoxic (5% CO2, 1% O2, 94% N2) conditions were treated as indicated, followed by wound-healing assay (n = 3 independent experiments). (eii, fii) Representative bar graphs showing relative migration at 12 h (eii; *P<0.05 versus control; **P<0.05 versus CR) and 6 h (fii, *P<0.05 versus control; **P and ***P<0.05 versus CR), respectively, compared with 0 h in indicated samples (n = 3 independent experiments).
Figure 4
Figure 4
Effect of CR infection on epigenetic parameters. (a) Nuclear colonic crypt or crypt-denuded lamina propria extracts from uninfected normal (N) or days 6, 12 and 34 post-CR-infected mice were subjected to western blots with antibodies for indicated proteins (n = 3 independent experiments). (b) Western blots showing relative abundance of H3K27m3, EZH2 and H3K36m3 in the crypt nuclear extracts. H3 was used as loading control (n = 3 independent experiments). (c) Real-time PCR showing fold change in Dkk-2 expression in the crypt isolated from uninfected normal (N) or days 6, 12 and 34 post-CR-infected mice. *P<0.05 versus N (n = 3 independent experiments). (d) Western blots showing relative abundance of H3K27m3, EZH2 and H3K36m3 in the crypt-denuded lamina propria. H3 was used as loading control (n = 3 independent experiments). (ei) Effect of knocking down EZH2 on Wnt and NF-κB pathways in vitro. 293HEK cells were transfected with either TOPflash or FOPflash reporters as well as NF-κB reporter, respectively. Cells were treated with control siRNA or EZH2-siRNA for 48 h followed by measurement of reporter activity using Renilla luciferase as internal control (*P<0.05 versus control; n = 3 independent experiments). (eii) Western blots showing relative levels of EZH2, H3K27m3 and β-catenin following knockdown of EZH2. Actin was used as loading control (n = 3 independent experiments). (f, g) Chromatin immunoprecipitation (ChIP) assay. Crypt genomic DNA was extracted from uninfected normal or days 6 (f) or 12 (g) post-infected distal colons. A ChIP assay was performed with antibodies specific for EZH2 (f) and H3K4me3 (g), respectively. The DNA purified after ChIP was evaluated by semiquantitative PCR using specific primers that recognize the genomic DNA sequences of indicated markers. The amount of DNA after the ChIP assay was normalized to the input DNA level. The bar graphs represent the fold enrichment relative to input (n = 3 independent experiments).
Figure 5
Figure 5
Crypt cells in culture exhibit colonosphere and organoid/colonoid formation. (ai) Colonic crypt cells were isolated from uninfected normal or 6, 12 and 34 days post-CR-infected (CR-D6, CR-D12, CR-D34) NIH:Swiss mice and directly embedded in 0.3% soft agar. A set of two independent experiments are shown. Please note the significant growth of day-12 and -34 colonospheres at 5 and 8 weeks post plating. (aii) is a representative bar graph showing average number of colonospheres formed/well at indicated times compared with uninfected controls. *P<0.05 versus control (n = 5 independent experiments). (bi) Cells from 6, 12 and 34 days post-CR-infected mouse distal colonic crypts growing as monolayers and showing evidence of EMT were trypsinized, and regrown in 0.3% soft agar for 5 and 8 weeks, respectively. (bii) is a representative bar graph showing average number of organoids formed/well at indicated time points compared with uninfected controls. *P<0.05 versus day 6 (n = 5 independent experiments). (ci) Trypsinized cells from 12 and 34 days as described in (bi) were regrown in Matrigel for 21 days, and were followed for colonoid formation in vitro. Please note the gradual appearance of crypt-like structures on day 21, suggesting a process of MET transition. (cii) A single colonoid from day 12 group was sectioned and stained for: H&E, PAS to label goblet cells, Ki-67 to label proliferating cells and for DCLK1 as a stem cell marker. (d) Western blots showing DCLK1 and Lgr5 levels in the colonoids at indicated time points (n = 3 independent experiments).
Figure 6
Figure 6
Signaling via the Wnt/β-catenin and Notch pathways are critical for EMT and for colonosphere formation. (ai) CR-infected mice received intraperitoneal injections of either nanoparticle-encapsulated β-catenin siRNA (si-β-Cat) or γ-secretase inhibitor DBZ for 10 days, followed by crypt isolation and plating for monolayer formation. Please note the almost-complete lack of monolayer formation when cells were isolated from animals treated with either si-β-Cat or DBZ separately or in combination. (aii,aiii) Western blots for indicated proteins in the colonic crypt cellular extracts prepared from uninfected normal (N), CR-infected (CR), CR-infected + vehicle-treated (CR + V), CR-infected and either si-β-Cat (CR + si) or DBZ-treated (CR + DBZ) mice (n = 3 independent experiments). (bi) Colonic crypt cells isolated from above group of animals were tested for their ability to form colonospheres in vitro. Although day 12 cells formed colonospheres as expected, si-β-Cat-treated cells failed to form any colonosphere. DBZ alone also inhibited colonosphere formation, but the inhibition was more efficient when the two inhibitors were given in combination. (bii) A representative bar graph showing average number of colonosphere formed/well at indicated time points compared with uninfected controls. *P<0.05 versus uninfected control; **P<0.05 versus CR-D12 (ND, not detected; n = 5 independent experiments).
Figure 7
Figure 7
Partial or complete transformation of colonic crypt cells following mutagenic insult. (ai) Uninfected or days 12 (CR-D12) and 34 (CR-D34) CR-infected NIH:Swiss mice were given AOM (D12 + AOM, D34 + AOM) for 8 h. and their colonic crypts were isolated and tested for their ability to form monolayers. (aii) Cells growing as monolayers and showing evidence of EMT were trypsinized and regrown in 0.3% soft agar for 5–8 weeks. Please note the significant colonospheres/organoid formation, particularly from days 12 and 34 cells. (aiii) A representative bar graph showing average number of colonospheres/organoids formed/well at indicated time points. *P<0.05 versus day 6 (n = 5 independent experiments). (bi) Uninfected or days 12 (CR-D12) and 34 (CR-D34) CR-infected NIH:Swiss mice were given AOM (N + AOM, D12 + AOM, D34 + AOM) weekly for 3 weeks, and their colonic crypts were isolated and tested for their ability to form monolayers. Please note the lack of monolayer formation in N + AOM, D12 + AOM and D34 + AOM groups. (bii) Colonic crypt cells isolated from animal groups described in (bi) were directly embedded in 0.3% soft agar and followed for colonosphere formation for 21 days. (biii) A representative bar graph showing average number of colonospheres formed/well in each group. *P<0.05 versus control (n = 5 independent experiments).
Figure 8
Figure 8
Monolayers in culture stain positive for markers of mesenchymal and cancer stem cells. (A) Uninfected normal (N) or days 6, 12 and 34 post-CR-infected NIH:Swiss mice were given AOM (N + AOM; D6 + AOM; D12 + AOM, D34 + AOM) for 8 h followed by crypt isolation, and cultured as monolayers. Cells growing as monolayers were stained for markers of mesenchymal and stem cells. Please note the significant co-staining of fibronectin with DCLK1 particularly on days 12 and 34 (arrowheads; n = 3 independent experiments). (bi–biii) Representative bar graphs showing percent cells positive for DCLK1 (bi; *P<0.05 versus N + AOM), fibronectin (Bii; *P<0.05 versus N + AOM) and DCLK1, and fibronectin colocalization (biii; *P<0.05 versus N + AOM), respectively (n = 3 independent experiments).
Figure 9
Figure 9
CR/AOM treatment promotes nodular and/or tumorigenic growth in athymic nude mice. (a) Day-12 colonospheres from both Gp1 and Gp2 mice were dissociated and injected subcutaneously into athymic nude mice, and followed for tumor formation in vivo. Upper panel: kinetics of nodule/tumor formation from day-12 or -34 colonosphere in the absence of AOM; middle panel: nodular/tumor growth of day-12 or -34 colonospheres from group 1 (8-h AOM) mice; lower panel: complete kinetics of nodular/tumor growth from uninfected, days 6, 12 or 34 animals in group 2 (3 weeks of AOM injection). (b) Tumor growth curve. Line graph showing percent growth of the xenograft in the two groups versus control (P and ◆◆P<0.05 versus control; n = 3 independent experiments). (c) Paraffin-embedded sections prepared from a day-12 tumor were stained with antibodies specific for: vimentin, cytokeratin and DCLK1 (n = 3 independent experiments).

Similar articles

Cited by

References

    1. Humphries A, Wright NA. Colonic crypt organization and tumorigenesis. Nat Rev Cancer. 2008;8:415–424. - PubMed
    1. van der Flier LG, Clevers H. Stem cells, self-renewal, and differentiation in the intestinal epithelium. Annu Rev Physiol. 2009;71:241–260. - PubMed
    1. May R, Sureban SM, Hoang N, Riehl TE, Lightfoot SA, Ramanujam R, et al. Doublecortin and CaM kinase-like-1 and leucine-rich-repeat-containing G-protein-coupled receptor mark quiescent and cycling intestinal stem cells, respectively. Stem Cells. 2009;27:2571–2579. - PMC - PubMed
    1. Reya T, Morrison SJ, Clarke MF, Weissman IL. Stem cells, cancer, and cancer stem cells. Nature. 2001;414:105–111. - PubMed
    1. Radisky DC, LaBarge MA. Epithelial-mesenchymal transition and the stem cell phenotype. Cell Stem Cell. 2008;2:511–522. - PubMed

Publication types