. 2013:9:672.
doi: 10.1038/msb.2013.26.

The functional interactome landscape of the human histone deacetylase family

Affiliations

The functional interactome landscape of the human histone deacetylase family

Preeti Joshi et al. Mol Syst Biol. 2013.

Abstract

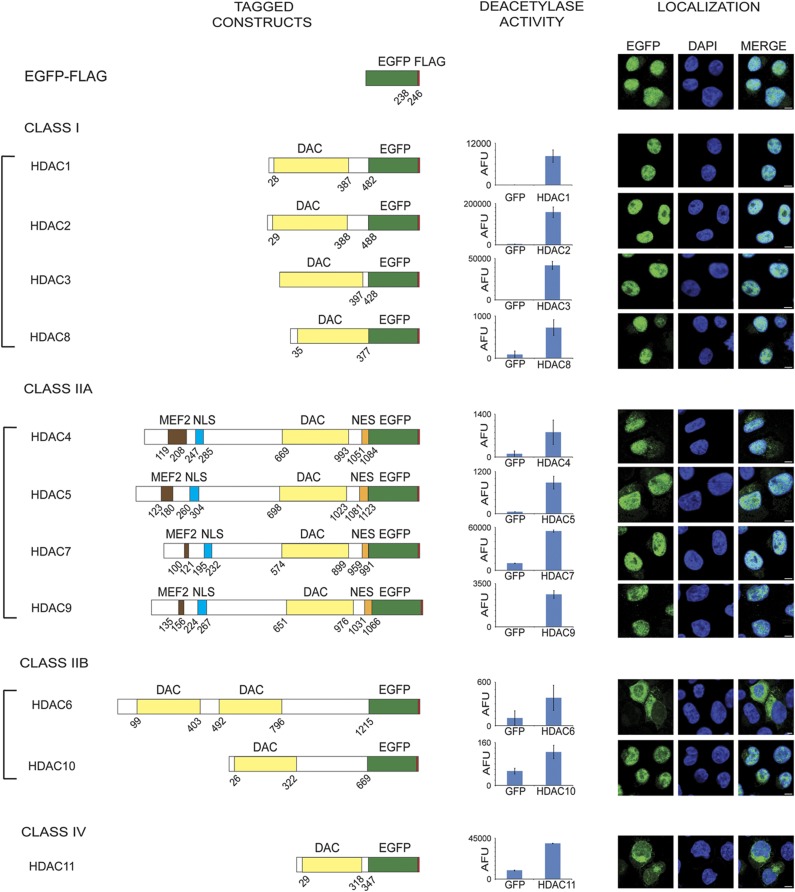
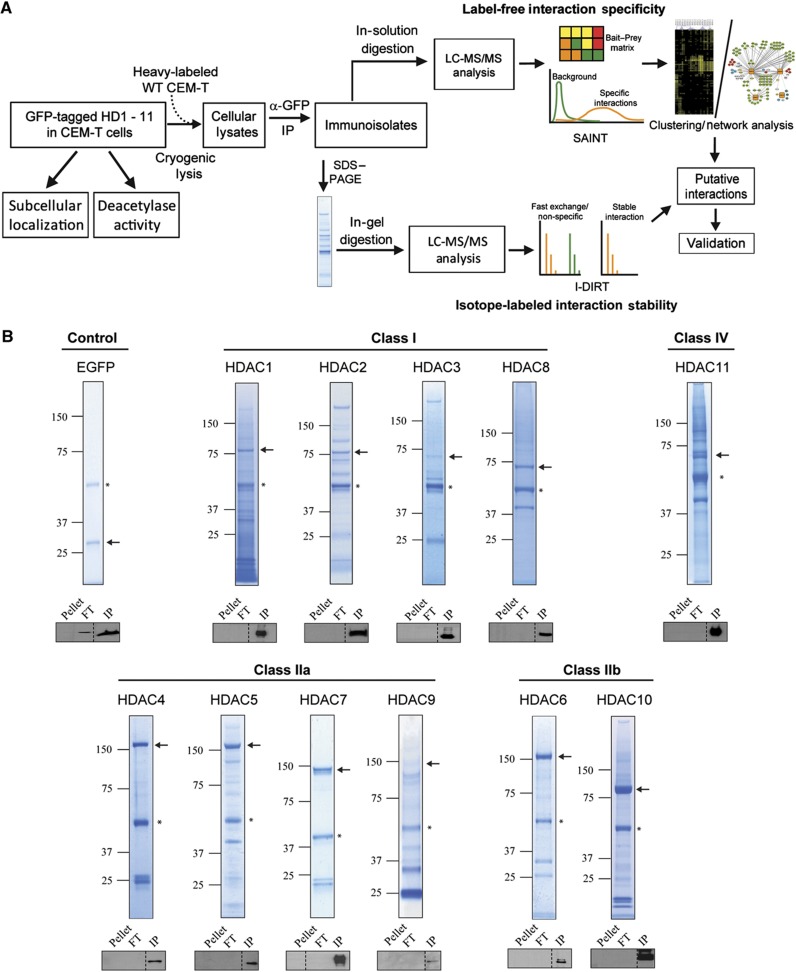
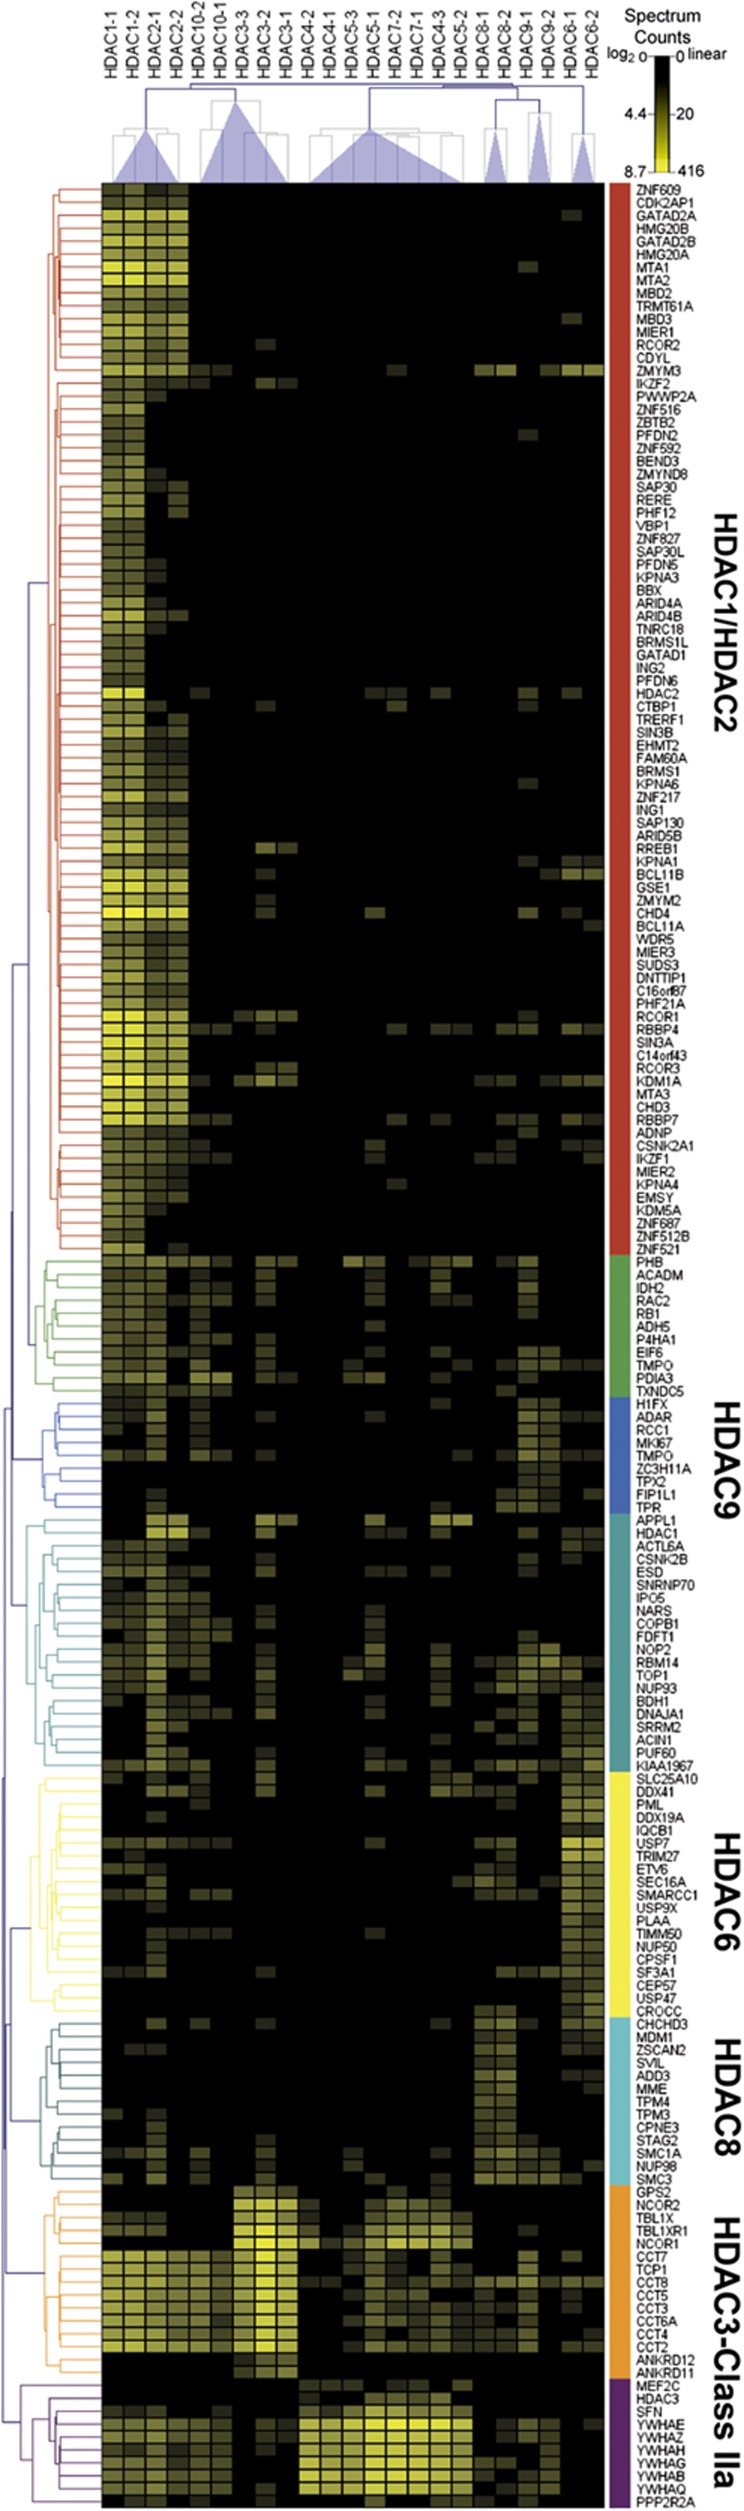
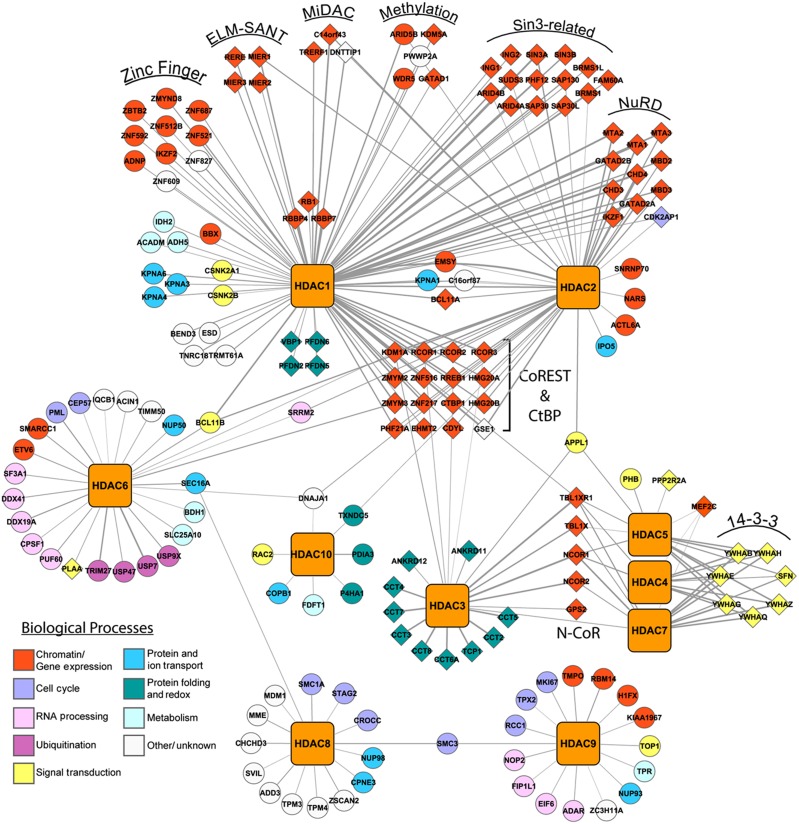
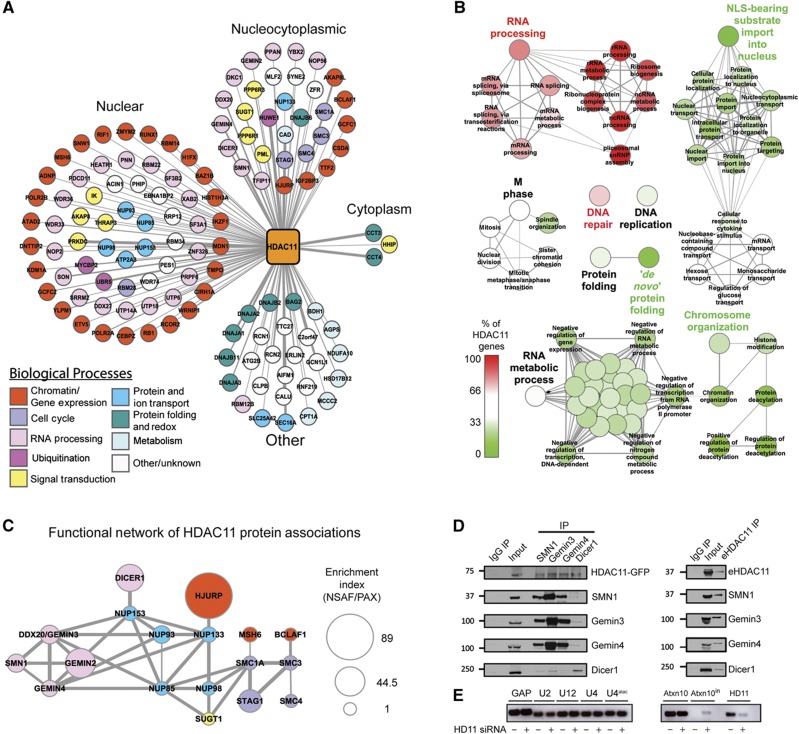
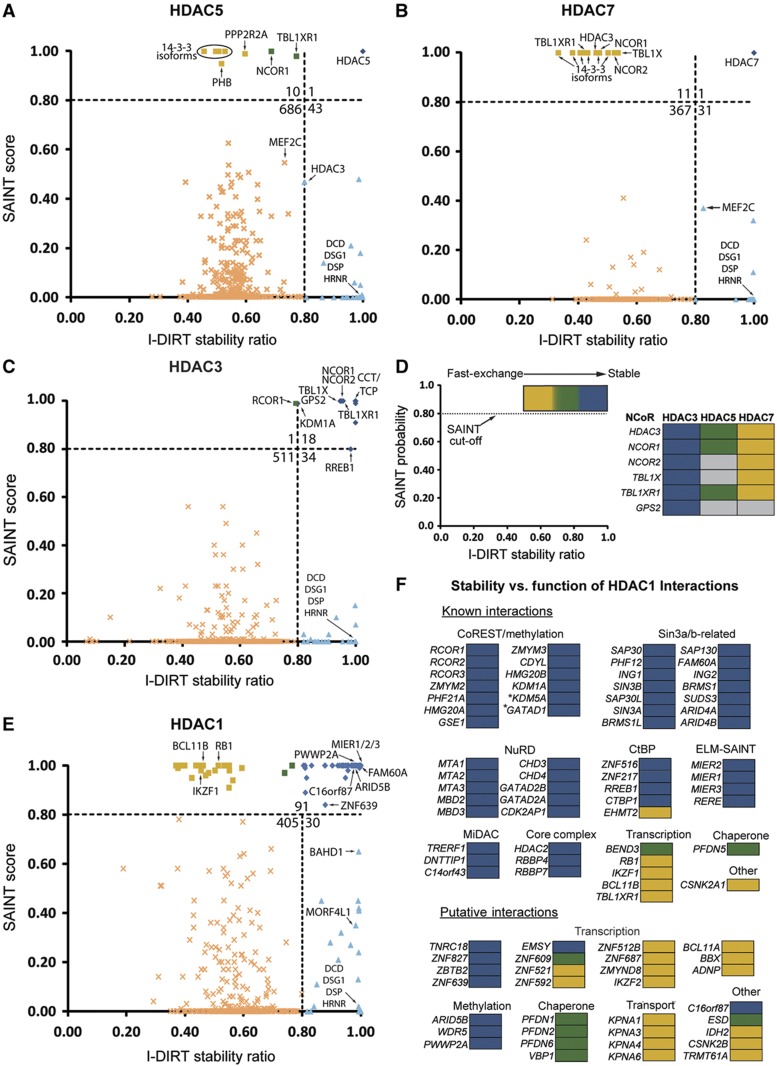
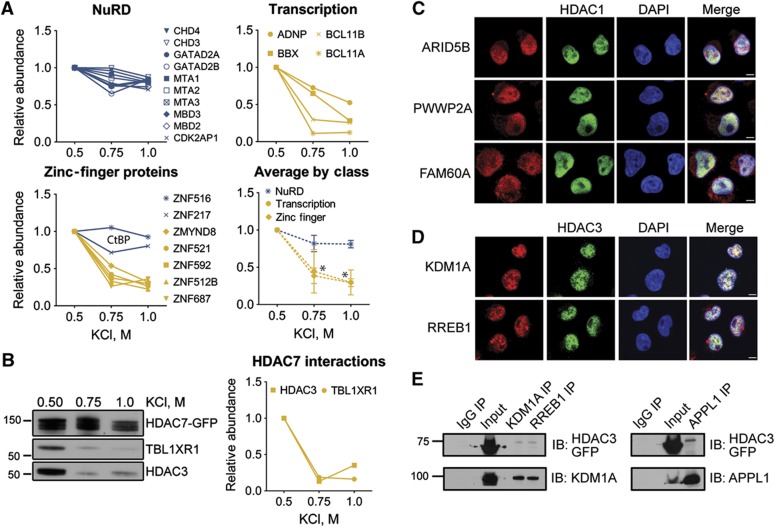
Histone deacetylases (HDACs) are a diverse family of essential transcriptional regulatory enzymes, that function through the spatial and temporal recruitment of protein complexes. As the composition and regulation of HDAC complexes are only partially characterized, we built the first global protein interaction network for all 11 human HDACs in T cells. Integrating fluorescence microscopy, immunoaffinity purifications, quantitative mass spectrometry, and bioinformatics, we identified over 200 unreported interactions for both well-characterized and lesser-studied HDACs, a subset of which were validated by orthogonal approaches. We establish HDAC11 as a member of the survival of motor neuron complex and pinpoint a functional role in mRNA splicing. We designed a complementary label-free and metabolic-labeling mass spectrometry-based proteomics strategy for profiling interaction stability among different HDAC classes, revealing that HDAC1 interactions within chromatin-remodeling complexes are largely stable, while transcription factors preferentially exist in rapid equilibrium. Overall, this study represents a valuable resource for investigating HDAC functions in health and disease, encompassing emerging themes of HDAC regulation in cell cycle and RNA processing and a deeper functional understanding of HDAC complex stability.


Conflict of interest statement

The authors declare that they have no conflict of interest.

Figures

Figure 1
Figure 1
Construction and validation of EGFP–FLAG tagged HDACs 1–11. (Left) HDAC 1–11 tagged with EGFP (green)–FLAG (red) at their C terminus. Boundaries of the deacetylase (yellow), MEF2 binding (brown), nuclear localization signal NLS (blue) and nuclear export signal NES (orange) regions are indicated. (Center) Deacetylase activity of HDACs isolated from CEM T cells measured using the Fluor-de-Lys assay (n=3, AFU±s.d.), as compared to EGFP–FLAG controls. (Right) Localization of EGFP–FLAG tagged HDACs in CEM T-cell lines using anti-GFP antibody (green); DNA is indicated by DAPI (blue); × 63 oil immersion lens; scale bar, 5 μm.
Figure 2
Figure 2
Proteomic workflow and immunoisolation of 11 EGFP-tagged human HDACs. (A) Workflow for immunoisolation of HDACs from CEM T cell lines stably expressing HDAC–EGFP. HDAC–EGFP immunoisolates were subjected to label-free and isotope-labeled AP-MS workflows using SAINT and/or I-DIRT analysis, respectively. Hierarchical clustering and interaction networks visualized HDAC–HDAC and HDAC–prey relationships. Candidate protein interactions from global AP-MS were supported by molecular imaging and biochemical approaches. (B) Representative SDS–PAGE separations of Coomassie-stained EGFP-tagged HDAC1–11 immunoisolates. EGFP only immunoisolate is shown as a control. Arrows indicate the band containing the isolated bait. *, contaminant band. Western blotting assessed efficiency of HDAC–EGFP recovery in elution (IP) fraction relative to unbound flowthrough (FT) and insoluble cell pellet (pellet). Ten percent of each fraction was analyzed.
Figure 3
Figure 3
Clustering of HDAC protein interaction profiles. Hierarchical clustering analysis of HDAC1–10 and 180 SAINT-filtered prey proteins. Clustering was performed as a function of log2-transformed spectral counts using Pearson correlation and average linkage between biological replicates from 23 independent HDAC–EGFP isolations. Prey clusters were color coded according to the respective dendrogram.
Figure 4
Figure 4
Comprehensive HDAC interaction network. Cytoscape interaction network representing 180 SAINT-filtered putative HDAC–prey interactions. HDAC–prey interactions were visualized by network edges. Preys were manually classified and color coded by biological processes. If known, preys were also grouped by subcomplex or function. Diamond and circle nodes indicate previously identified and uncharacterized HDAC interactions, respectively. Edge thickness indicates log2-transformed prey spectral counts.
Figure 5
Figure 5
HDAC11 functional interaction network analysis identifies components of snRNP biogenesis complexes. (A) Cytoscape interaction network of putative HDAC11 interactions. 124 SAINT-filtered proteins co-isolated with HDAC11 were grouped by subcellular localizations. Proteins were color coded by biological processes. Circle-shaped nodes indicate previously unreported interactions. (B) GO biological process (GO BP) network comparing classifications of HDAC11 versus the HDAC1–10 interactome data set. GO BP terms, assigned by the ClueGO Cytoscape plugin, depict functions that are (1) common (white circles, 33–66% of HDAC11 genes), (2) enriched in HDAC11 (red circles, >66% of HDAC11 genes), or (3) enriched in the HDAC1–10 interactome (green circles, <33% of HDAC11 genes). For clarity, a subset of GO BP term labels relating to detailed RNA metabolic processes were removed (see Supplementary Figure S6A). (C) STRING functional network of prominent candidate HDAC11 interactions visualized in Cytoscape. Nodes were color coded by biological processes indicated in (A). Node size was expressed as an enrichment index, which is the protein’s normalized spectral abundance factor (NSAF) relative to its estimated cellular abundance in the PAX database, normalized to SUGT1 set at an arbitrary value of one. (D) Validation of selected HDAC11 interactions by reciprocal isolations and immunopurification of endogenous HDAC11 (eHDAC11). IgG was used as a control. Left, immunoaffinity purifications of endogenous SMN1, Gemin3, Gemin4, or Dicer1, and detection of complex members by western blot. Right, immunoaffinity purification of eHDAC11. (E) Splicing defects in the ATXN10 U12-type intron 10 upon knockdown of HDAC11 in WT CEM T cells. RNA levels upon treatment with HDAC11 siRNA or a scrambled control were quantified by qRT–PCR (n=3). A representative agarose gel is shown to visualize the levels of indicated PCR products. Left, mRNA of GAPDH (GAP) and snRNA of U2, U12, U4 and U4atac. Right, mRNA of ATXN10, ATXN10_intron, and HDAC11.
Figure 6
Figure 6
Profiling of relative interaction stability within HDAC-containing complexes. Scatter plots show the relationship between interaction specificity (SAINT scores) and stability/specificity (I-DIRT ratios). Data shown are for common protein identifications between label-free and isotope-labeled AP-MS approaches from (A) HDAC5, (B) HDAC7, (C) HDAC3, and (E) HDAC1 isolations. Dashed lines represent selected thresholds and total protein number in each quadrant is shown. Selected data points are labeled with gene symbols. (D) Left, a region of high SAINT specificity, but varying I-DIRT ratios (0.5 to 1.0), is indicated by a color coded gradient indicating a stability range. Right, the relative stability of NCoR complex members is compared for HDAC3, 5, and 7. Gray boxes indicate the protein was absent or below SAINT threshold. (F) Known (top) and putative (bottom) HDAC1 interactions with SAINT scores>0.80 (n=90) are listed as gene symbols, depicted with their relative stability (D), and classified by known HDAC1 complexes or cellular function.
Figure 7
Figure 7
Biochemical validation and confocal immunofluorescence confirm HDAC interactions identified by proteomics. (A) Biochemical validation of HDAC1 interaction stability. The relative abundance of HDAC1 interactions from immunoisolations performed under increasing salt concentration was determined for selected high (blue) and low (yellow) stability proteins comprising the NuRD complex (top left), transcription factors (top right), and zinc-finger proteins (bottom left). The average relative abundance (±s.d.) of these classes as a function of [KCl] (bottom right) is plotted, excluding ZNF518 and ZNF217 (CtBP complex members). Statistical significance of KCl-dependent relative abundances was assessed compared to the average NuRD-relative abundance (two-way ANOVA, *P<0.001). (B) Biochemical validation of HDAC7 interaction stability. The relative abundances of TBL1XR1 and HDAC3 were assessed by western blotting, normalized by densitometry to HDAC7. (C) Colocalization of HDAC1–EGFP with ARID5B, PWWP2A, and FAM60A, and (D) colocalization HDAC3–EGFP with KDM1A and RREB1 in CEM T-cell lines. Localization of EGFP-tagged HDACs and selected proteins were detected using anti-GFP antibody (green) and antibodies against endogenous proteins (red); DNA is visualized by DAPI (blue); × 63 oil immersion lens; scale bar 5 μm. (E) Reciprocal affinity purifications (IP) for HDAC3–EGFP using antibodies against endogenous KDM1A and RREB1 (left), and APPL1 (right). EGFP-tagged HDAC3 was detected by western blot. IgG was used as negative control.

Comment in

  • The HDAC interaction network.
    Livyatan I, Meshorer E. Livyatan I, et al. Mol Syst Biol. 2013;9:671. doi: 10.1038/msb.2013.33. Mol Syst Biol. 2013. PMID: 23752267 Free PMC article. No abstract available.

References

    1. Akimova T, Beier UH, Liu Y, Wang L, Hancock WW (2012) Histone/protein deacetylases and T-cell immune responses. Blood 119: 2443–2451 - PMC - PubMed
    1. Ando Y, Tomaru Y, Morinaga A, Burroughs AM, Kawaji H, Kubosaki A, Kimura R, Tagata M, Ino Y, Hirano H, Chiba J, Suzuki H, Carninci P, Hayashizaki Y (2011) Nuclear pore complex protein mediated nuclear localization of dicer protein in human cells. PloS one 6: e23385. - PMC - PubMed
    1. Aranda B, Achuthan P, Alam-Faruque Y, Armean I, Bridge A, Derow C, Feuermann M, Ghanbarian AT, Kerrien S, Khadake J, Kerssemakers J, Leroy C, Menden M, Michaut M, Montecchi-Palazzi L, Neuhauser SN, Orchard S, Perreau V, Roechert B, van Eijk K et al. (2010) The IntAct molecular interaction database in 2010. Nucleic Acids Research 38: D525–D531 - PMC - PubMed
    1. Baba A, Ohtake F, Okuno Y, Yokota K, Okada M, Imai Y, Ni M, Meyer CA, Igarashi K, Kanno J, Brown M, Kato S (2011) PKA-dependent regulation of the histone lysine demethylase complex PHF2-ARID5B. Nature Cell Biol 13: 668–675 - PubMed
    1. Banach-Orlowska M, Pilecka I, Torun A, Pyrzynska B, Miaczynska M (2009) Functional characterization of the interactions between endosomal adaptor protein APPL1 and the NuRD co-repressor complex. Biochem J 423: 389–400 - PMC - PubMed

Publication types

MeSH terms