

Impact of short term consumption of diets high in either non-starch polysaccharides or resistant starch in comparison with moderate weight loss on indices of insulin sensitivity in subjects with metabolic syndrome
- PMID: 23752495
- PMCID: PMC3725498
- DOI: 10.3390/nu5062144
Impact of short term consumption of diets high in either non-starch polysaccharides or resistant starch in comparison with moderate weight loss on indices of insulin sensitivity in subjects with metabolic syndrome
Abstract
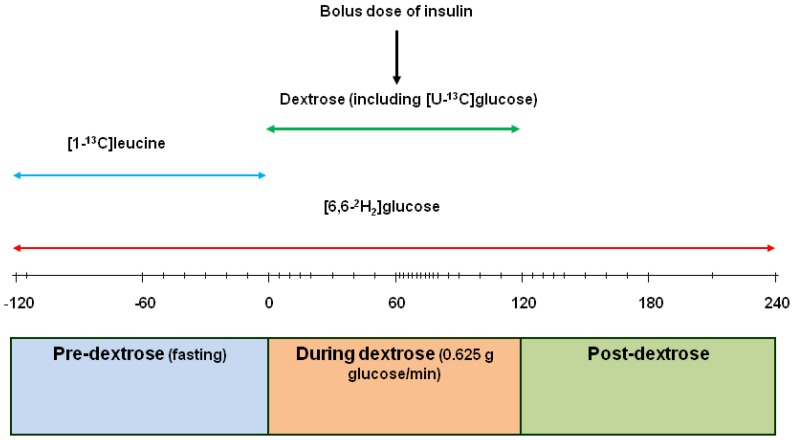
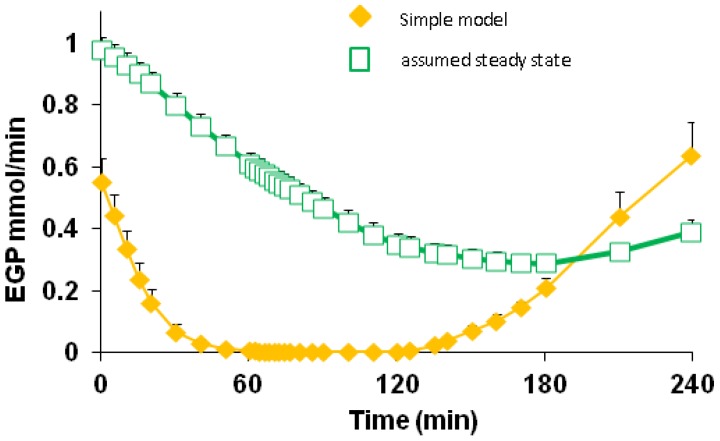
This study investigated if additional non-starch polysaccharide (NSP) or resistant starch (RS), above that currently recommended, leads to better improvement in insulin sensitivity (IS) than observed with modest weight loss (WL). Obese male volunteers (n = 14) were given an energy-maintenance (M) diet containing 27 g NSP and 5 g RS daily for one week. They then received, in a cross-over design, energy-maintenance intakes of either an NSP-enriched diet (42 g NSP, 2.5 g RS) or an RS-enriched diet (16 g NSP, 25 g RS), each for three weeks. Finally, a high protein (30% calories) WL diet was provided at 8 MJ/day for three weeks. During each dietary intervention, endogenous glucose production (EGP) and IS were assessed. Fasting glycaemia was unaltered by diet, but plasma insulin and C-peptide both decreased with the WL diet (p < 0.001), as did EGP (-11%, p = 0.006). Homeostatis model assessment of insulin resistance improved following both WL (p < 0.001) and RS (p < 0.05) diets. Peripheral tissue IS improved only with WL (57%-83%, p < 0.005). Inclusion of additional RS or NSP above amounts currently recommended resulted in little or no improvement in glycaemic control, whereas moderate WL (approximately 3 kg fat) improved IS.
Figures
Similar articles
-
Effects of a high-protein, low-carbohydrate v. high-protein, moderate-carbohydrate weight-loss diet on antioxidant status, endothelial markers and plasma indices of the cardiometabolic profile.Br J Nutr. 2011 Jul;106(2):282-91. doi: 10.1017/S0007114511000092. Br J Nutr. 2011. PMID: 21521539 Clinical Trial.
-
Nondigestible Carbohydrates Affect Metabolic Health and Gut Microbiota in Overweight Adults after Weight Loss.J Nutr. 2020 Jul 1;150(7):1859-1870. doi: 10.1093/jn/nxaa124. J Nutr. 2020. PMID: 32510158 Clinical Trial.
-
Effects of additional starch or fat in late-gestating high nonstarch polysaccharide diets on litter performance and glucose tolerance in sows.J Anim Sci. 2004 Oct;82(10):2964-71. doi: 10.2527/2004.82102964x. J Anim Sci. 2004. PMID: 15484948
-
Resistant starch ameliorated insulin resistant in patients of type 2 diabetes with obesity: a systematic review and meta-analysis.Lipids Health Dis. 2019 Nov 24;18(1):205. doi: 10.1186/s12944-019-1127-z. Lipids Health Dis. 2019. PMID: 31760943 Free PMC article.
-
Resistant starch and energy balance: impact on weight loss and maintenance.Crit Rev Food Sci Nutr. 2014;54(9):1158-66. doi: 10.1080/10408398.2011.629352. Crit Rev Food Sci Nutr. 2014. PMID: 24499148 Free PMC article. Review.
Cited by
-
Dietary macronutrients and the gut microbiome: a precision nutrition approach to improve cardiometabolic health.Gut. 2022 Jun;71(6):1214-1226. doi: 10.1136/gutjnl-2020-323715. Epub 2022 Feb 8. Gut. 2022. PMID: 35135841 Free PMC article. Review.
-
Role of polysaccharides in food, digestion, and health.Crit Rev Food Sci Nutr. 2017 Jan 22;57(2):237-253. doi: 10.1080/10408398.2014.939263. Crit Rev Food Sci Nutr. 2017. PMID: 25921546 Free PMC article. Review.
-
Reviving grain quality in wheat through non-destructive phenotyping techniques like hyperspectral imaging.Food Energy Secur. 2023 Sep 3;12(5):e498. doi: 10.1002/fes3.498. eCollection 2023 Sep. Food Energy Secur. 2023. PMID: 38440412 Free PMC article. Review.
-
The detection and measurement of interleukin-6 in venous and capillary blood samples, and in sweat collected at rest and during exercise.Eur J Appl Physiol. 2014 Jun;114(6):1207-16. doi: 10.1007/s00421-014-2851-8. Epub 2014 Mar 1. Eur J Appl Physiol. 2014. PMID: 24577845
-
Effects of Resistant Starch Supplementation on Glucose Metabolism, Lipid Profile, Lipid Peroxidation Marker, and Oxidative Stress in Overweight and Obese Adults: Randomized, Double-Blind, Crossover Trial.Clin Nutr Res. 2019 Oct 28;8(4):318-328. doi: 10.7762/cnr.2019.8.4.318. eCollection 2019 Oct. Clin Nutr Res. 2019. PMID: 31720257 Free PMC article.
References
Publication types
MeSH terms
Substances
LinkOut - more resources
Full Text Sources
Other Literature Sources
Medical
