. 2013 Aug 1;73(15):4732-43.
doi: 10.1158/0008-5472.CAN-12-3989. Epub 2013 Jun 10.

Posttranscriptional regulation of PER1 underlies the oncogenic function of IREα

Affiliations

Posttranscriptional regulation of PER1 underlies the oncogenic function of IREα

Olivier Pluquet et al. Cancer Res. .

Abstract

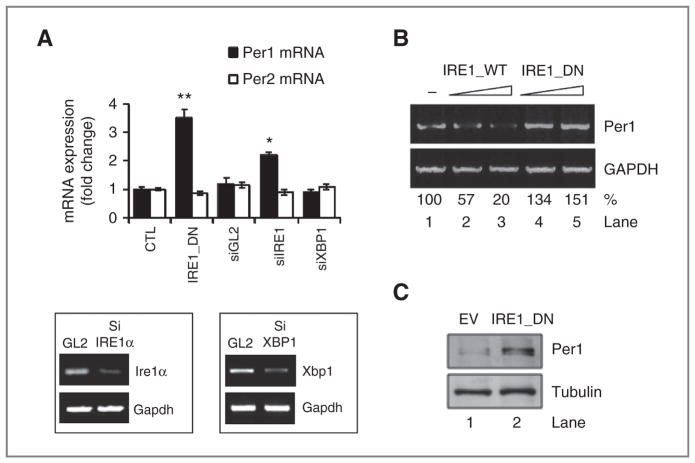
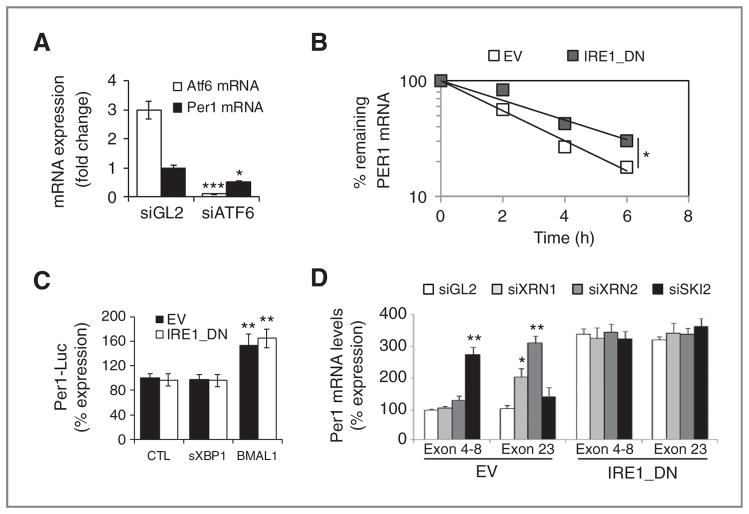
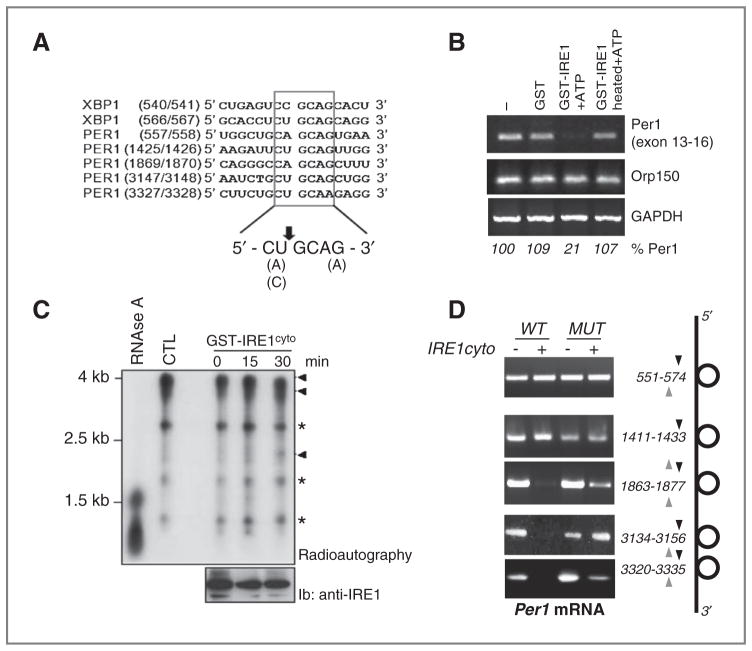
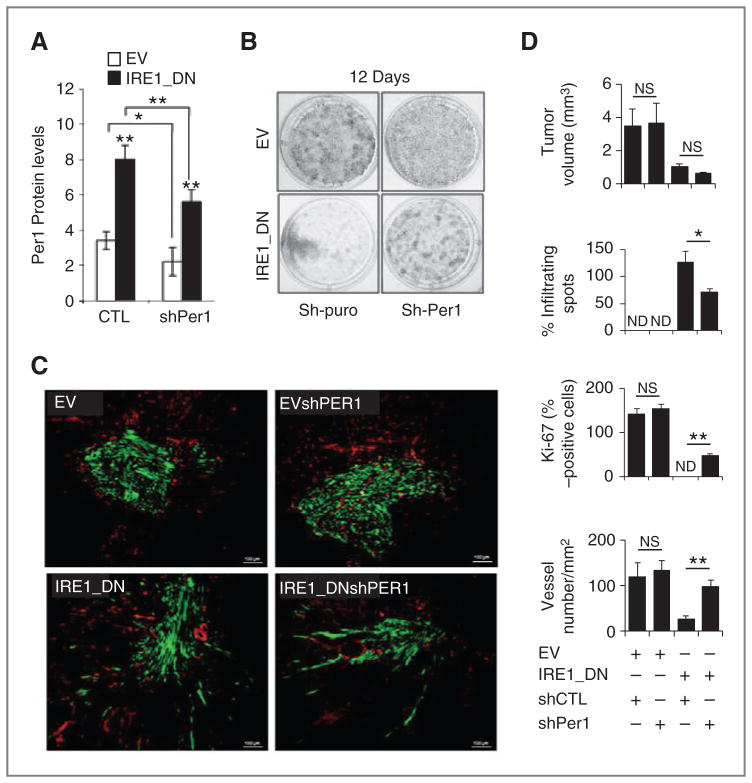
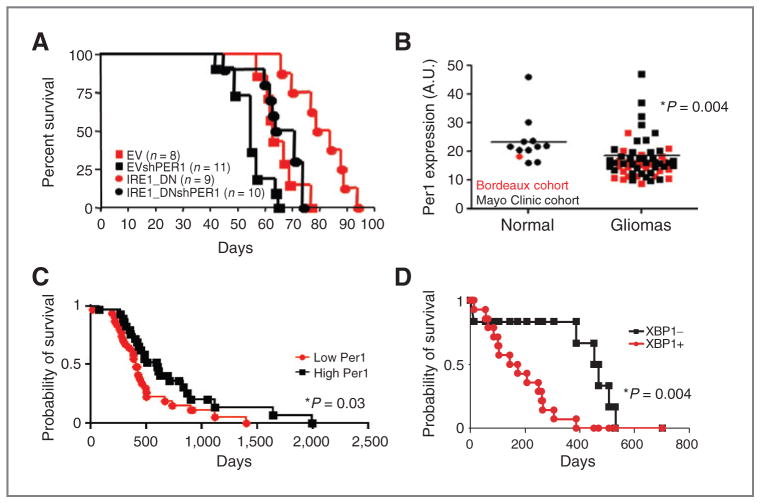
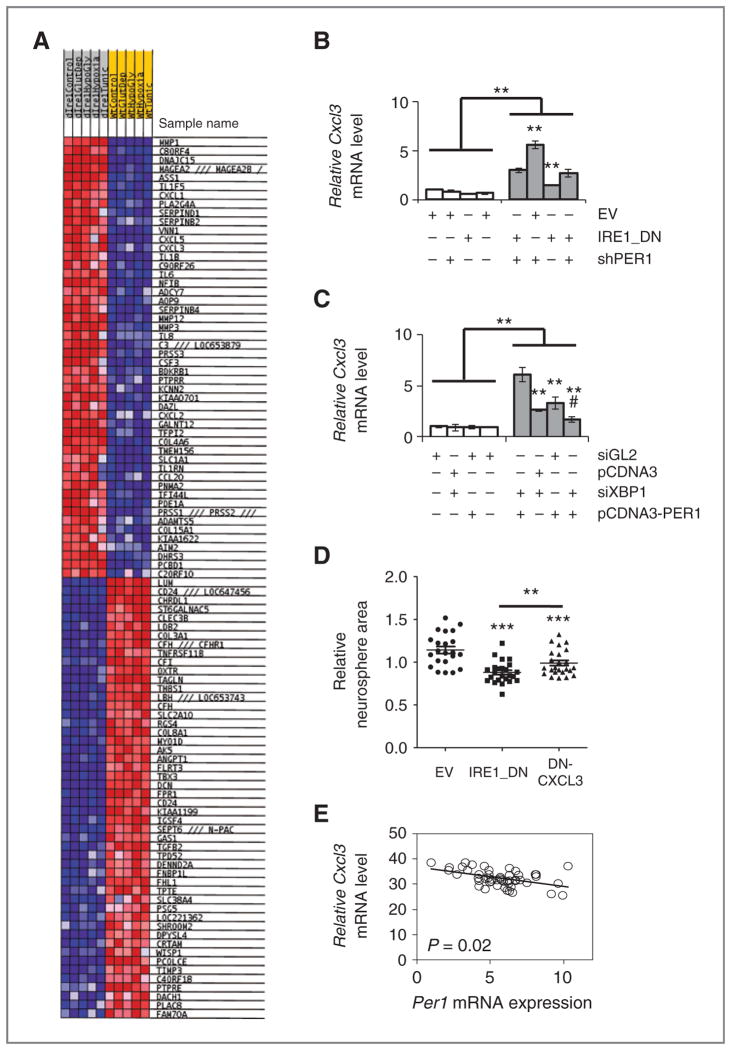
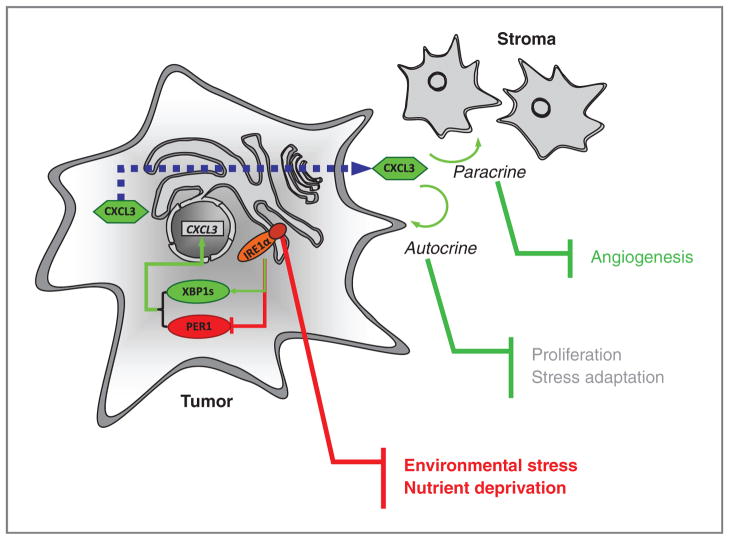
Growing evidence supports a role for the unfolded protein response (UPR) in carcinogenesis; however, the precise molecular mechanisms underlying this phenomenon remain elusive. Herein, we identified the circadian clock PER1 mRNA as a novel substrate of the endoribonuclease activity of the UPR sensor IRE1α. Analysis of the mechanism shows that IRE1α endoribonuclease activity decreased PER1 mRNA in tumor cells without affecting PER1 gene transcription. Inhibition of IRE1α signaling using either siRNA-mediated silencing or a dominant-negative strategy prevented PER1 mRNA decay, reduced tumorigenesis, and increased survival, features that were reversed upon PER1 silencing. Clinically, patients showing reduced survival have lower levels of PER1 mRNA expression and increased splicing of XBP1, a known IRE-α substrate, thereby pointing toward an increased IRE1α activity in these patients. Hence, we describe a novel mechanism connecting the UPR and circadian clock components in tumor cells, thereby highlighting the importance of this interplay in tumor development.


Conflict of interest statement

Disclosure of Potential Conflicts of Interest

J.N. Sarkaria has a commercial research grant from Genentech, Basilea, Sanofi, and Merck. E. Chevet has a commercial research grant from Servier. No potential conflicts of interest were disclosed by the other authors.

Figures

Figure 1
Figure 1
Impaired IRE1α activity leads the upregulation of PER1 mRNA. A, expression of PER1 and PER2 mRNA was measured by PCR in control (EV) and IRE1_DN U87 cells as well as U87 cells subjected to IRE1α silencing, XBP1 silencing, or luciferase silencing as control (GL2) by siRNA for 72 hours (insets). PER1 and PER2 mRNA levels were normalized to RPLP0 levels (t test; *, P < 0.05; **, P < 0.001). B, U87 cells were transiently transfected with increasing concentrations of plasmids encoding for WT-IRE1α or DN K599A IRE1α, followed by mRNA extraction. The expression of PER1 and Gapdh was assessed by RT-PCR. C, PER1 and tubulin protein levels in empty vector and IRE1_DN cells.
Figure 2
Figure 2
IRE1α-mediated posttranscriptional control of PER1 mRNA in cultured cells. A, PER1 (closed) and ATF6 (open) mRNA expression as determined by quantitative RT-PCR in cells transfected with siRNA against luciferase (siGL2) and ATF6 (siATF6). Experiments were carried out in triplicate and the mean ± SD, statistical significance (Student t test) is indicated (*, P < 0.05; ***, P < 0.01). B, empty vector and IRE1_DN cells were cotransfected with control plasmid (pCMV-rL) or PER1 promoter-dependent luciferase reporter and either an empty pCDNA3 vector, a pCDNA3-sXBP1 vector, or a pCDNA3-BMAL1 vector. Cells were then lysed and lysates analyzed with the Dual-Luciferase Reporter Kit (Promega). Results were normalized against pCMV-Renilla luciferase (t test, **P < 0.05). C, actinomycin D pulse-chase was carried out as described in Materials and Methods. Total mRNA was extracted and quantitative RT-PCR experiments were conducted using PER1 mRNA-specific primer pairs. The experiment was repeated 3 times and data are presented as mean ± SD. Statistical significance was determined using Student t test, *, P < 0.03. D, empty vector and IRE1_DN cells were transfected with siRNA against XRN1/2 or SKI2. RNA was isolated after 48 hours and was used to amplify different regions of PER1 mRNA. Experiments were carried out in triplicate and the mean ± SD, statistical significance (Student t test) is indicated (*, P < 0.05; **, P < 0.01).
Figure 3
Figure 3
IRE1α-mediated posttranscriptional control of PER1 mRNA in vitro. A, sequence alignment of XBP1 mRNA IRE1α-mediated cleavage sites with similar regions in PER1 mRNAs. B, in vitro RNA cleavage assay. Total RNA extracted from U87 cells was incubated with GST or GST-IRE1α-cyto in the presence of ATP for 2 hours at 37°C. RT-PCR was then conducted to determine PER1, ORP150, and GAPDH mRNA levels. C, PER1 cDNA sequence cloned into the pCDNA3 vector was used as template for in vitro transcription using the T7 Ribomax kit (Promega) in the presence of 32P-UTP. The resulting radiolabeled riboprobe was then incubated or not with dephosphorylated GST-hIRE1cyto for the indicated periods of time or with RNase A for 15 minutes at room temperature. The reaction products were resolved by PAGE and revealed by radioautography on X-ray films. The amount of recombinant GST-IRE1cyto added to the reaction is shown in the bottom blot using immunoblot with anti-IRE1 antibodies. *, nonspecific bands; Arrowheads, full and cleaved PER1 mRNA products. D, PER1 mRNA wild-type and mutated on each potential IRE1α cleavage sites were transcribed in vitro and subjected to in vitro cleavage with GST-hIRE1cyto as in F. Reaction products were then subjected to RT-PCR with specific primers flanking each cleavage site.
Figure 4
Figure 4
Impact of PER1 mRNA expression levels on IRE1_DN cell-derived tumors. A, the expression of PER1 was monitored using immunoblot analysis in empty vector and IRE1_DN cells silenced or not for PER1 (shPER1). Quantification of 3 independent experiments is represented as the mean ± SD. B, empty vector (EV) and IRE1_DN cells and their shPER1 counterparts were seeded in 6-well plates at equal densities. Cells were allowed to form colonies for 12 days. The colonies were stained with crystal violet 0.1%. C, intracranial implantation of U87 cells expressing either the IRE1_DN or the empty vector in the presence of pGIPZ-GFP-shPER1 or pGIPZ-GFP lentiviral vector was done in nude mice (n = 16). Immunohistochemical staining of tumor and surrounding tissue was done using anti-CD31 antibodies (red). Scale bar, 100 μm. D, quantification of implanted tumors’ features. Intracerebral tumor volume was determined. Four independent tumors were measured for each clone. Infiltrating spots were estimated by counting tumor field at ×5 magnification for each condition (t test, ns, nonsignificant; *, P < 0.05). The percentage of dividing cells (Ki-67 positive) in the 4 types of tumors was estimated by counting 5 different fields at ×40 magnification for each experiment. The mean Ki-67 intensity per condition is plotted with error bars representing SD. Significant differences are indicated between each empty vector and IRE1_DN pairs, and between empty vector compared with IRE1_DN. Vascular density was quantified by counting vessels from 5 randomly chosen fields per animal (n = 4 animals per conditions) and normalized to the tumor surface. Significant differences are indicated between each empty vector and IRE1_DN pairs, and between empty vector compared with IRE1_DN (t test, NS, nonsignificant; ***, P < 0.0005; **, P < 0.001; *, P < 0.05).
Figure 5
Figure 5
IRE1/PER1 signaling axis in tumor growth. A, overall survival of mice subjected to intracranial implantation of empty vector and IRE1_DN cells and their shPER1 counterparts was reported in Kaplan–Meier survival curves. (EV vs. IRE1_DN, P < 0.001; IRE1_DN vs. IRE1_DNshPER1, P < 0.001; EV vs. IRE1_DNshPER1, P = NS; log-rank test). B, qPCR analysis of PER1 mRNA expression in 60 glioblastoma cancer samples and 12 normal brain tissues. Bordeaux cohort is indicated in red, Mayo Clinic cohort in black. The results are expressed in arbitrary units as a ratio of PER1 transcripts to Rplp0 transcripts. The P value is indicated. C, high (n = 31) and low (n = 29) PER1 mRNA level correlates with patient survival. Values were plotted in Kaplan–Meier survival curves. Statistical difference between the 2 groups is indicated. Statistical difference between the 2 groups in indicated P = 0.03; log-rank test. D, Kaplan–Meier survival curves of patients displaying negative sXBP1 staining (6; XBP1−) or positive sXBP1 staining (14; XBP1+). P = 0.004; log-rank test.
Figure 6
Figure 6
Relevance of IRE1 signaling in cancer. A, heatmap for microarray results. Blue, upregulation; Red, downregulation. B, U87 cells-expressing or not functional IRE1α and silenced or not for PER1 were starved or not of glucose for 16 hours in presence of dialyzed serum; CXCL3 mRNA abundance was measured by qPCR. Messenger RNA levels were normalized to those of RPLP0 and to untreated control. Error bars represent the SDs of at least 3 independent experiments. (t test, NS, nonsignificant; *, P < 0.05). C, U87 cells were transfected with siXBP1 for 72 hours and/or with pcDNA3PER1 for 24 hours before glucose deprivation for additional 16 hours. Total RNA was purified from these cells and analyzed by qRT-PCR for CXCL3 expression (using GAPDH as internal reference). The experiment was carried out in triplicate and is presented as the mean ± SD. Statistical significance was determined using the Student t test. *, P < 0.06; ***, P < 0.01; #, P < 0.03. D, sixty-two human glioblastoma samples (24 Bordeaux cohort; 38 Mayo cohort) were analyzed for Per1 and Cxcl3 mRNA expression using qRT-PCR. Three technical replicates were conducted. Data indicate a negative correlation (slope = −0.75) with statistical significance (P = 0.0208).
Figure 7
Figure 7
Schematic representation of the IRE1α-dependent activation loop that controls tumor cell adaptation. Tumor cell is presented in light gray and stromal cells in dark gray. Proteins are represented by circles; green, upregulation; red, downregulation. Connections following stress-mediated activation of IRE1α are presented in green for activation and red for inhibition. The dashed blue line represents the traffic of CXCL3 protein through the secretory pathway.

Similar articles

Cited by

References

    1. Moenner M, Pluquet O, Bouchecareilh M, Chevet E. Integrated endoplasmic reticulum stress responses in cancer. Cancer Res. 2007;67:10631–4. - PubMed
    1. Schroder M, Kaufman RJ. The mammalian unfolded protein response. Annu Rev Biochem. 2005;74:739–89. - PubMed
    1. Greenman C, Stephens P, Smith R, Dalgliesh GL, Hunter C, Bignell G, et al. Patterns of somatic mutation in human cancer genomes. Nature. 2007;446:153–8. - PMC - PubMed
    1. Bifulco G, Miele C, Di Jeso B, Beguinot F, Nappi C, Di Carlo C, et al. Endoplasmic reticulum stress is activated in endometrial adenocarcinoma. Gynecol Oncol. 2012;125:220–5. - PubMed
    1. Davies MP, Barraclough DL, Stewart C, Joyce KA, Eccles RM, Barraclough R, et al. Expression and splicing of the unfolded protein response gene XBP-1 are significantly associated with clinical outcome of endocrine-treated breast cancer. Int J Cancer. 2008;123:85–8. - PubMed

Publication types

MeSH terms