. 2013 Jul 19;288(29):21422-21432.
doi: 10.1074/jbc.M113.453837. Epub 2013 Jun 10.

Structure and function of allophanate hydrolase

Affiliations

Structure and function of allophanate hydrolase

Chen Fan et al. J Biol Chem. .

Abstract

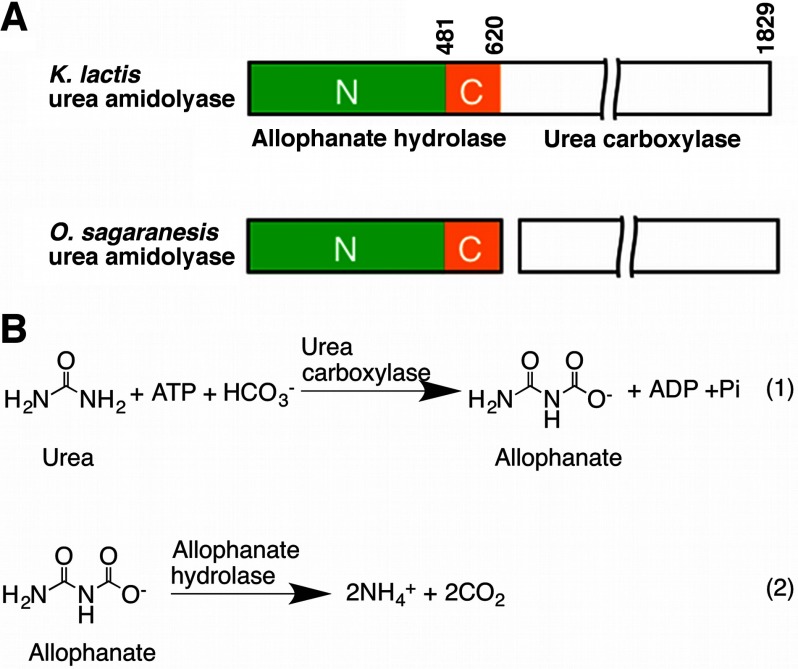
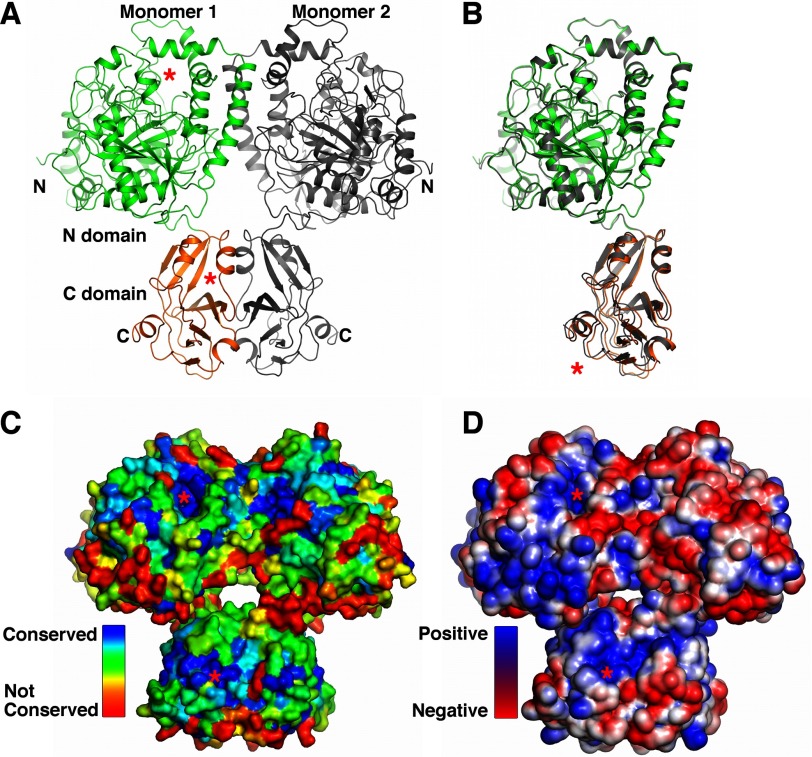
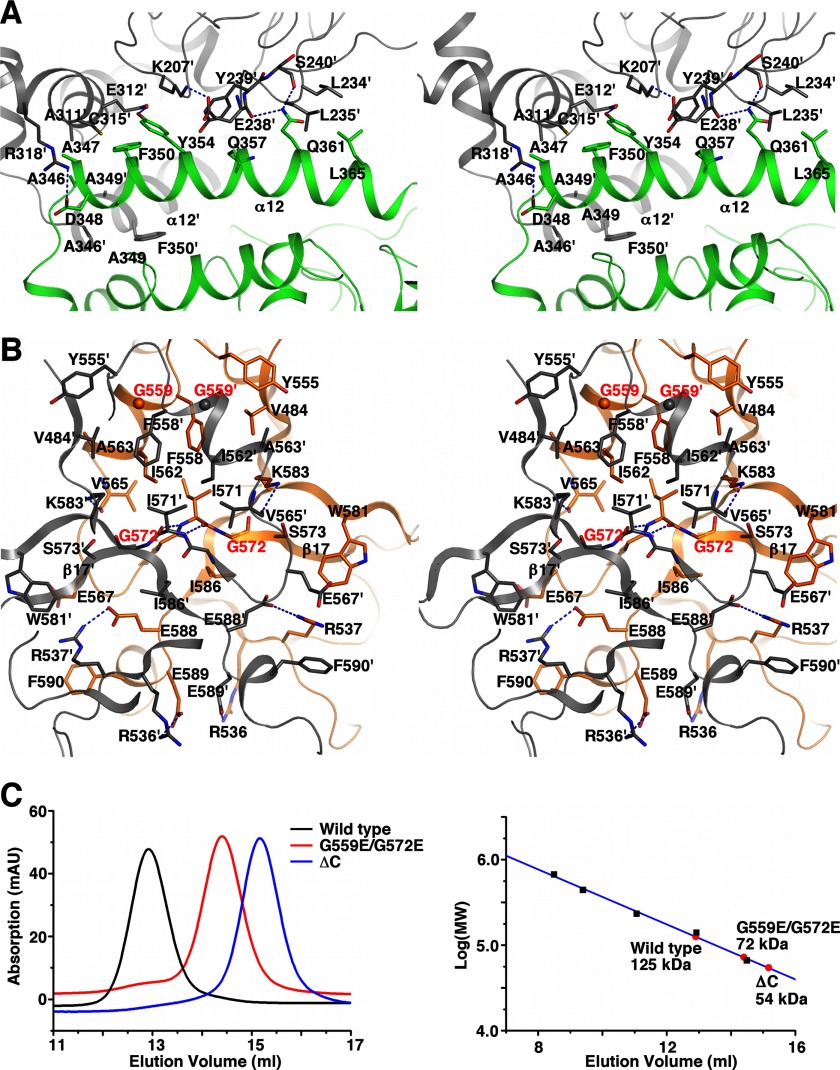
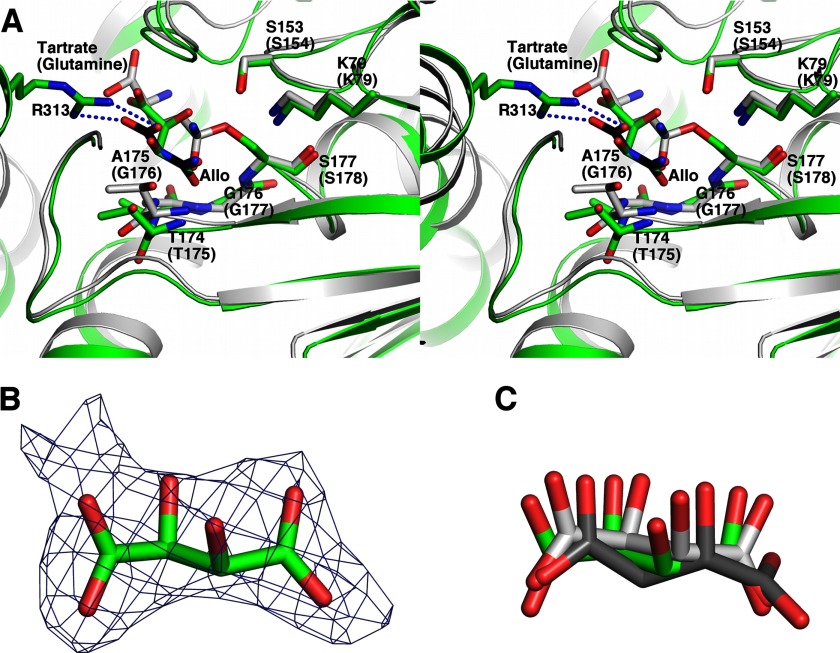
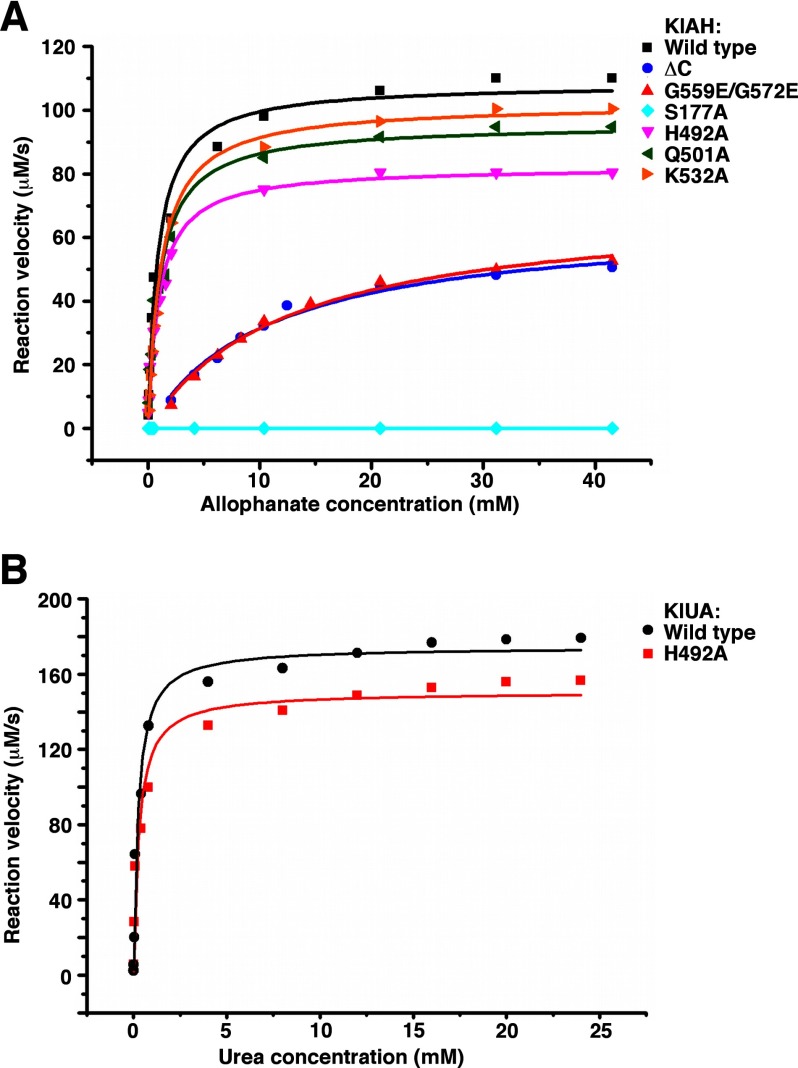
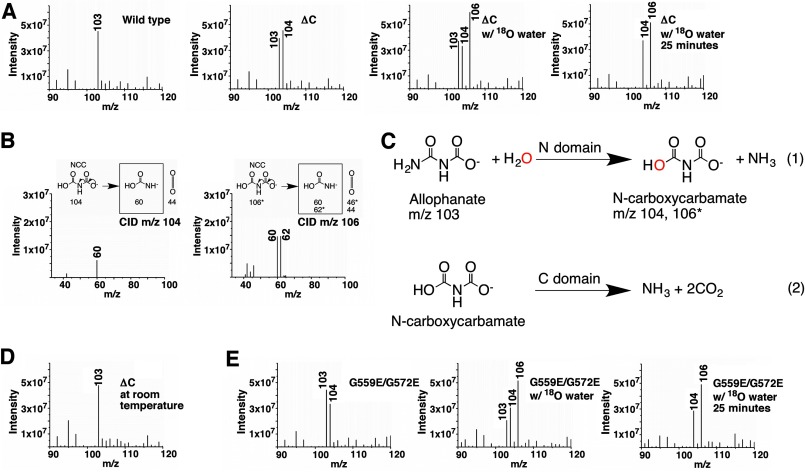
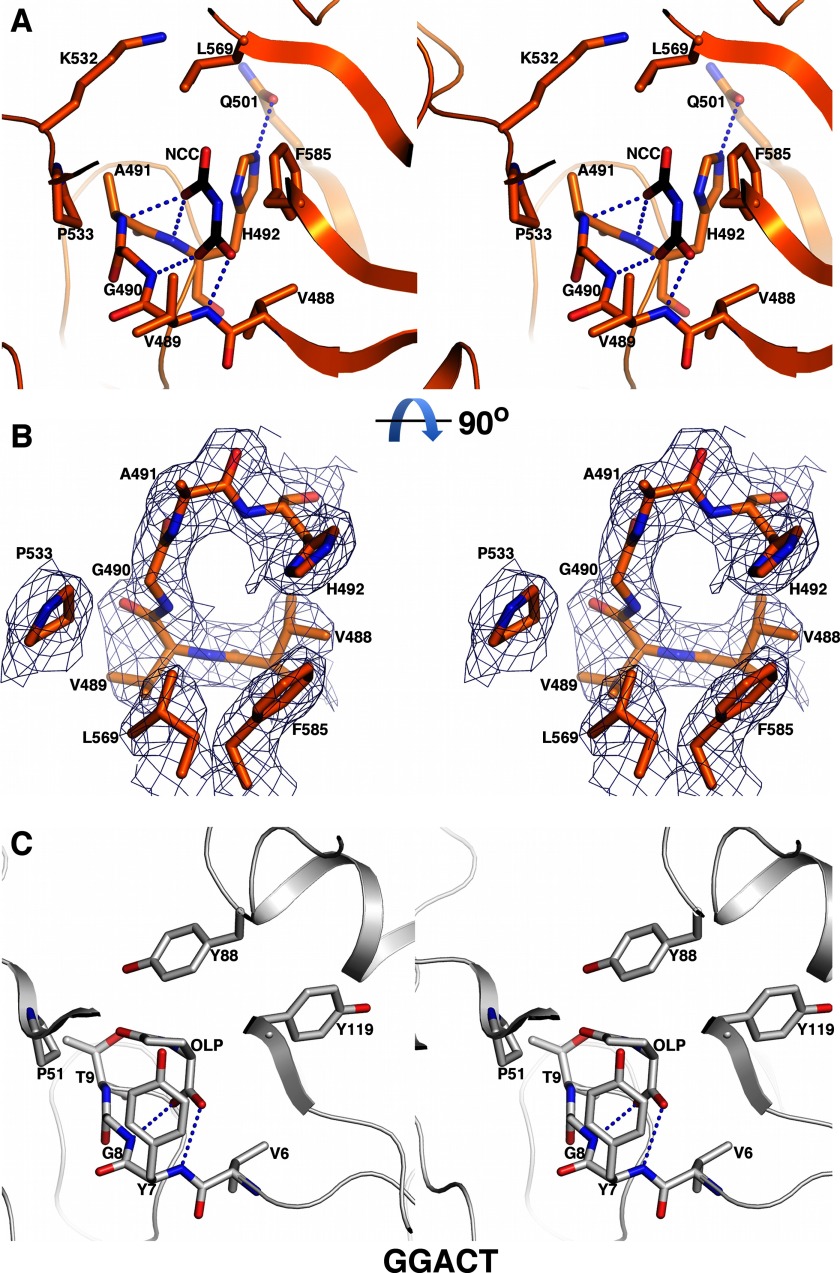
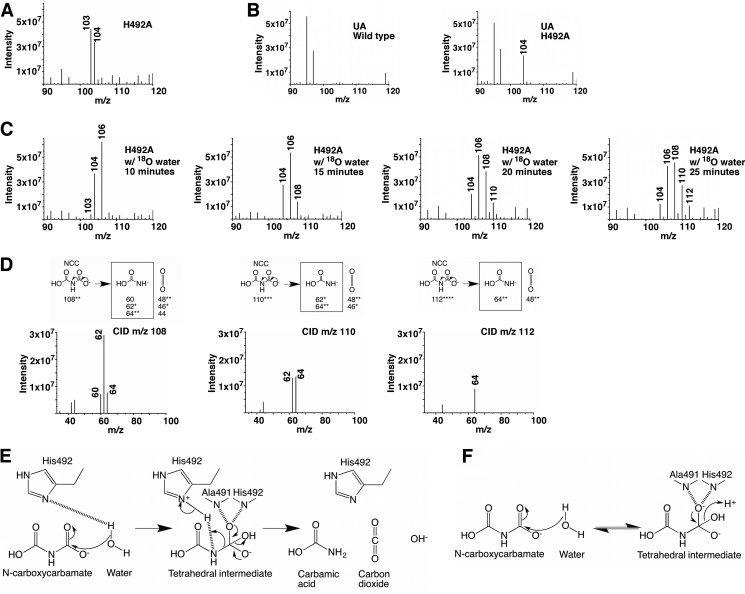
Allophanate hydrolase converts allophanate to ammonium and carbon dioxide. It is conserved in many organisms and is essential for their utilization of urea as a nitrogen source. It also has important functions in a newly discovered eukaryotic pyrimidine nucleic acid precursor degradation pathway, the yeast-hypha transition that several pathogens utilize to escape the host defense, and an s-triazine herbicide degradation pathway recently emerged in many soil bacteria. We have determined the crystal structure of the Kluyveromyces lactis allophanate hydrolase. Together with structure-directed functional studies, we demonstrate that its N and C domains catalyze a two-step reaction and contribute to maintaining a dimeric form of the enzyme required for their optimal activities. Our studies also provide molecular insights into their catalytic mechanism. Interestingly, we found that the C domain probably catalyzes a novel form of decarboxylation reaction that might expand the knowledge of this common reaction in biological systems.

Keywords: Allophanate Hydrolase; Amidase Signature Family; Decarboxylase; Enzyme Catalysis; Enzyme Structure; Nitrogen Metabolism; Urea Utilization; X-ray Crystallography.


Figures

FIGURE 1.
FIGURE 1.
Domain architecture and reactions catalyzed by UA. A, domain organization of UA. Domain boundaries are indicated for the K. lactis UA. The N and C domains of the AH component are colored in green and orange, respectively. This color scheme is used throughout the figures unless otherwise indicated. B, reactions catalyzed by the urea carboxylase and AH components of UA. O., Oleomonas.
FIGURE 2.
FIGURE 2.
Overall structure of KlAH. A, structure of the KlAH dimer. The KlAH dimer observed in the crystal is colored in green and orange for one monomer and gray for the other. Structures in A, C, and D are shown in the same orientation. The red stars indicate surface pockets on the N and C domains. B, superimposition of the KlAH monomers. One monomer in the KlAH dimer is colored in green and orange, and the other is in gray. Their N domains are aligned, and the red star indicates differences in their C domain position. C, conservation of residues in the KlAH dimer. The KlAH dimer is shown in surface representation and colored according to the conservation of individual residues, which was calculated with the ConSurf server (46). D, surface charge distribution of the KlAH dimer. The KlAH dimer is shown in surface representation and is colored in blue and red for positively and negatively charged regions, respectively. Structure figures were prepared with PyMOL.
FIGURE 3.
FIGURE 3.
The KlAH dimer interface. A, stereoview of the N domain dimer interface. The two N domains are colored in green and gray, respectively. For clarity, only interface residues on helix α12 of monomer 1 and those they interact with on monomer 2 are shown. B, stereoview of the C domain dimer interface. The two C domains are colored in orange and gray, respectively. Red labels highlight residues Gly559 and Gly572 at the interface. C, gel filtration analysis of the wild type KlAH and the G559E/G572E and ΔC mutants. Experiments were performed on a Superdex 200 10/30 column (GE Healthcare) with a buffer containing 20 mm Tris/HCl, pH 7.5 and 200 mm NaCl (left panel). The column was calibrated with albumin (66 kDa), lactate dehydrogenase (140 kDa), catalase (232 kDa), ferritin (440 kDa), and thyroglobulin (669 kDa; black squares in the right panel). Apparent molecular weights of the wild type and mutant forms of KlAH are indicated (red circles in the right panel). mAU, milliabsorbance units.
FIGURE 4.
FIGURE 4.
Structure of the N domain active site. A, stereoview of the N domain active site. Structures of the KlAH N domain (green for the carbon atoms) and the S. aureus GatA (Protein Data Bank code 2F2A; gray for the carbon atoms) are superimposed and shown in stereo. Important catalytic residues conserved between them are highlighted. Labels enclosed in parentheses are for GatA. A model of allophanate (Allo) at the N domain active site is shown in black for its carbon atoms. Arg313, which is potentially important for the AH substrate specificity, is highlighted. The dashed lines indicate potential ion pair interactions between the allophanate molecule and the Arg313 side chain. B, difference density map for the tartrate molecule found at the wild type KlAH N domain active site. The map was calculated before tartrate and solvent molecules were included and contoured at 2 σ. C, superimposition of the tartrate molecules found at the N domain active site. Tartrate molecules were found at the active sites of one of the N domains in the wild type KlAH structure and both N domains in the S177A mutant structure. These N domains are aligned, and the tartrate molecules are shown. Their carbon atoms are colored in green for the wild type KlAH structure and different shades of gray for the S177A mutant structure.
FIGURE 5.
FIGURE 5.
Kinetic measurements. A, kinetic measurements of the wild type and mutant forms of KlAH. B, kinetic measurements of the wild type KlUA and its H492A mutant.
FIGURE 6.
FIGURE 6.
The N domain catalyzes the first step of the AH reaction. A, mass spectrometric analysis of reactions catalyzed by the wild type KlAH and its ΔC mutant. In the presence of 18O-labeled water, the reaction catalyzed by the ΔC mutant was sampled at 10 and 25 min. Reactions analyzed by mass spectrometry presented throughout the text were performed on ice and allowed to proceed for 10 min before being analyzed unless otherwise indicated. The m/z 103 peak corresponds to allophanate. B, CID analysis of the m/z 104 and 106 molecules. In the CID experiments described here and in Fig. 8D, the fragmentation of N-carboxycarbamate (NCC) and the m/z values (or molecular weights for the uncharged molecules) are shown in the upper panels. The number of stars indicates the number of oxygen atoms substituted by 18O. Fragments observed by mass spectrometry are enclosed in black boxes. C, reactions catalyzed by the N and C domains. The oxygen atom colored in red in N-carboxycarbamate comes from water. m/z values for allophanate and N-carboxycarbamate are indicated. The number of stars indicates the number of oxygen atoms substituted by 18O. D, mass spectrometric analysis of the reaction catalyzed by the ΔC mutant at room temperature. E, mass spectrometric analysis of reactions catalyzed by the G559E/G572E mutant. In the presence of 18O-labeled water, the reaction was sampled at 10 and 25 min.
FIGURE 7.
FIGURE 7.
Structure of the C domain active site. A, stereoview of the C domain active site. A model of N-carboxycarbamate (NCC) at the C domain active site is shown in black for its carbon atoms. The dashed lines indicate potential hydrogen bonding interactions. B, electron density map for the C domain active site. The map was contoured at 1 σ. Important active site residues are highlighted. A and B are roughly related by a 90° rotation along the horizontal axis. C, stereoview of the GGACT active site. The reaction product 5-oxo-l-proline (OLP) and hydrogen bonds between its carboxyl group and main chain amides are shown.
FIGURE 8.
FIGURE 8.
Molecular insights into the C domain catalyzed reaction. A, mass spectrometric analysis of the reaction catalyzed by the KlAH H492A mutant. B, mass spectrometric analysis of reactions catalyzed by the wild type KlUA and its H492A mutant. In both KlAH and KlUA, the H492A mutation caused a significant accumulation of N-carboxycarbamate (m/z 104). C, mass spectrometric analysis of the reaction catalyzed by the KlAH H492A mutant in the presence of 18O-labeled water. The reaction was sampled at 10, 15, 20, and 25 min. D, CID analysis of the m/z 108, 110, and 112 molecules. Refer to the legend of Fig. 6B for a detailed description. E, proposed reaction scheme for the C domain. F, possible reaction catalyzed by the C domain of the KlAH H492A mutant.

References

    1. Sterner R. W., Elser J. J. (2002) Ecological Stoichiometry: the Biology of Elements from Molecules to the Biosphere, pp. 44–79, Princeton University Press, Princeton, NJ
    1. Canfield D. E., Glazer A. N., Falkowski P. G. (2010) The evolution and future of Earth's nitrogen cycle. Science 330, 192–196 - PubMed
    1. Mobley H. L., Hausinger R. P. (1989) Microbial ureases: significance, regulation, and molecular characterization. Microbiol. Rev. 53, 85–108 - PMC - PubMed
    1. Mobley H. L., Island M. D., Hausinger R. P. (1995) Molecular biology of microbial ureases. Microbiol. Rev. 59, 451–480 - PMC - PubMed
    1. Sirko A., Brodzik R. (2000) Plant ureases: roles and regulation. Acta Biochim. Pol. 47, 1189–1195 - PubMed

Publication types

Associated data

LinkOut - more resources