. 2013 Jun 25;110(26):10824-9.
doi: 10.1073/pnas.1219256110. Epub 2013 Jun 10.

In vivo single branch axotomy induces GAP-43-dependent sprouting and synaptic remodeling in cerebellar cortex

Affiliations

In vivo single branch axotomy induces GAP-43-dependent sprouting and synaptic remodeling in cerebellar cortex

Anna Letizia Allegra Mascaro et al. Proc Natl Acad Sci U S A. .

Abstract

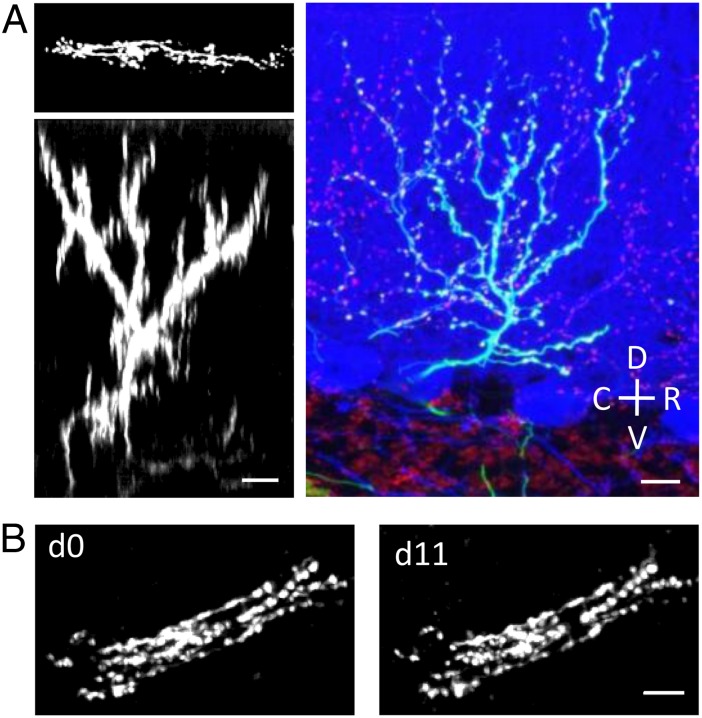
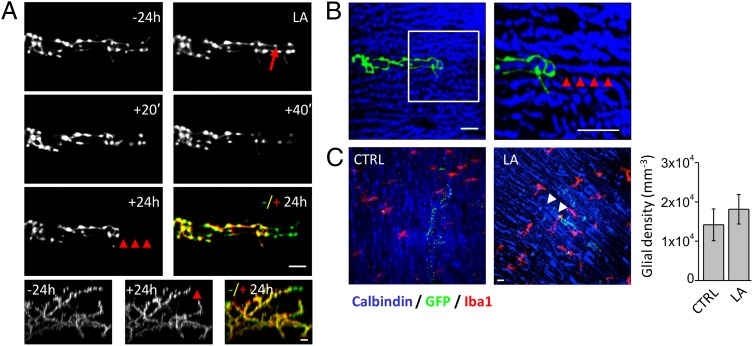
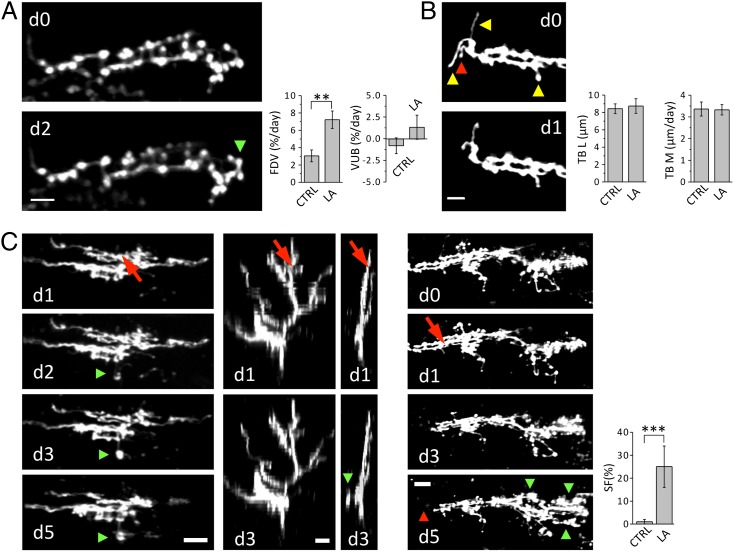
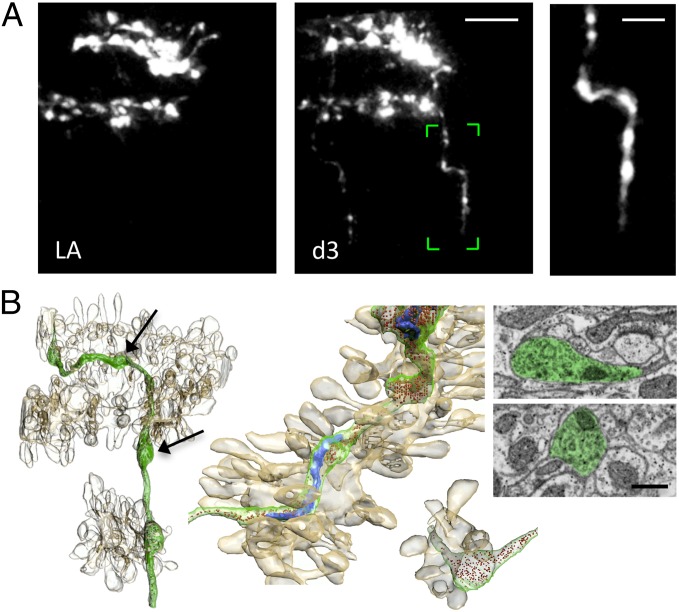
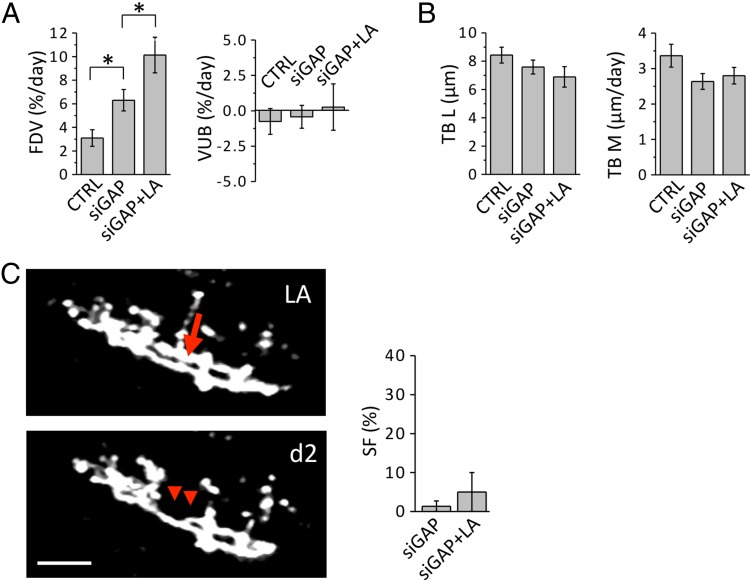
Plasticity in the central nervous system in response to injury is a complex process involving axonal remodeling regulated by specific molecular pathways. Here, we dissected the role of growth-associated protein 43 (GAP-43; also known as neuromodulin and B-50) in axonal structural plasticity by using, as a model, climbing fibers. Single axonal branches were dissected by laser axotomy, avoiding collateral damage to the adjacent dendrite and the formation of a persistent glial scar. Despite the very small denervated area, the injured axons consistently reshape the connectivity with surrounding neurons. At the same time, adult climbing fibers react by sprouting new branches through the intact surroundings. Newly formed branches presented varicosities, suggesting that new axons were more than just exploratory sprouts. Correlative light and electron microscopy reveals that the sprouted branch contains large numbers of vesicles, with varicosities in the close vicinity of Purkinje dendrites. By using an RNA interference approach, we found that downregulating GAP-43 causes a significant increase in the turnover of presynaptic boutons. In addition, silencing hampers the generation of reactive sprouts. Our findings show the requirement of GAP-43 in sustaining synaptic stability and promoting the initiation of axonal regrowth.

Keywords: brain injury; laser nanosurgery; neural plasticity; two-photon imaging.


Conflict of interest statement

The authors declare no conflict of interest.

Figures

Fig. 1.
Fig. 1.
In vivo imaging of CFs. (A) Two Left panels show the TPF transversal (maximum intensity z-projection of 60 images acquired from 0 to 120 μm deep below the pial surface) and sagittal view (digital rotation of the stack) of a single CF labeled by GFP expression in the cerebellar molecular layer. Right panel shows a confocal image of a single CF in a sagittal slice obtained from fixed cerebellum for comparison. CFs were labeled by GFP expression (green); Purkinje cells were labeled through immunofluorescent staining for Calbindin (in blue); CF varicosities in the molecular layer (together with some mossy fiber terminals in the granular layer) were labeled through immunofluorescent staining for VGlut2 (in red). C, caudal; D, dorsal; R, rostral; V, ventral. (B) Time-lapse images (TPF transversal view: maximum intensity z-projections) over a 12-d monitoring period showing the stability of CFs ascending branches. (Scale bar, 10 μm.)
Fig. 2.
Fig. 2.
In vivo multiphoton laser ablation of single axons. (A) Time course of a distal branch of a CF (TPF transversal view: maximum intensity z-projections) before (−24 h) and after laser axotomy (LA). The laser beam was focused on the axon where the red arrow points. Colored panel shows a superposition of the −24 h (green) and +24 h (red) frames. Red arrowheads at +24 h and the temporal merge highlight the degeneration of distal portion. Lower panels show sagittal views (digital rotation of the 3D TPF image) of the entire axonal arbor of the CF. (B) Confocal images of the same CF shown in A obtained from fixed cerebellum 1 d after laser axotomy. CFs (in green) are GFP labeled (maximum intensity z-projection from 0 to 88 μm below the pial surface); PCs (in blue) were labeled through immunofluorescent staining for Calbindin. The white box in B is shown magnified two times on the Right (maximum intensity z-projection of 8 μm). Red arrowheads highlight the integrity of the PC dendritic arbor within the region of the laser focus. (C) Confocal images showing CFs (in green), PCs (in blue), and microglial cells labeled through immunostaining for the anti-ionizing calcium-binding adaptor molecule 1 (Iba1) (in red) in a control region (CTRL) and around the lesion site (LA). White arrowheads in LA point at the region where the CF degenerated after laser axotomy. (Scale bar, 10 μm.) Right graph reports the density of microglial cells in CTRL (NCF = 9) and around the lesion site (LA, NCF = 8).
Fig. 3.
Fig. 3.
Reactive plasticity of CFs after laser axotomy. (A) Time course of a portion of a CF showing the formation of a new varicosity (green arrowhead). (Scale bar, 5 μm.) Graphs compare average fractions of dynamic varicosities (FDVs) and the varicosities unbalance (VUB) in control animals (FDV = 3.1 ± 0.7% per day; VUB = −0.79 ± 0.91% per day; NVar = 296, NCF = 6) and in CFs injured by LA (FDV = 7.2 ± 1.0% per day; VUB = 1.34 ± 1.39% per day; NVar = 433, NCF = 6). **P < 0.01 (two-tailed t test). (B) Time course of a portion of a CF displaying TB disappearance (red arrowhead) and remodeling (yellow arrowhead). Graphs compare TB length (TBL) and motility (TBM) in CTRL (TBL = 8.4 ± 0.5 µm; NTB = 62, NCF = 6; TBM = 3.4 ± 0.3 µm/d; NTB = 94, NCF = 6) and LA (TBL = 8.7 ± 0.8 µm; NTB = 55, NCF = 6; TBM = 3.3 ± 0.2 µm/d; NTB = 131, NCF = 6). (Scale bar, 5 μm.) (C) Left column images show the time course (from d1 to d5) of a CF after laser axotomy. The first image (d1) was acquired just before laser irradiation. The laser beam was focused on the axon where the red arrow points. Green arrowheads at d2, d3, and d5 highlight the protrusion of a new branch. Second and third column images show two orthogonal views (sagittal and coronal, respectively) of the same CF at d1 and d3. (Scale bar, 10 μm.) Right panels show another example of laser induced reactive plasticity. The first image (d0) was acquired 1 d before laser irradiation. The laser beam was focused on the axon at d1. Red and green arrowheads at d5 highlight the degeneration of the distal portion and the protrusion of new branches, respectively. (Scale bar, 15 μm.) Graph compares the sprouting frequency (SF) in CTRL (SF = 1 ± 1%; NCF = 92, Nmice = 8) and LA (SF = 25 ± 9%; NCF = 24, Nmice = 15). ***P < 0.001.
Fig. 4.
Fig. 4.
Correlative light and electron microscopy of the sprouted axon. (A) Time course of a CF showing the formation of a new branch 3 d after laser axotomy in vivo. (Scale bar, 10 μm.) Right image shows the sprouted axon boxed (in green) in the Center panel with clearly visible varicosities along its length. (Scale bar, 5 μm.) (B) Block face scanning electron microscopy, using FIBSEM, of the same sprouted axon, enables its reconstruction in 3D (shown in green) along with its mitochondria in blue and the vesicles colored in red. Also reconstructed were the surrounding dendritic segments and their spines (light brown). Center shows magnified two details of the same reconstruction: Top Left image highlights the contiguity of the sprouted branch and the PC dendrite; the Bottom Right image emphasizes the close proximity of a varicosity to two dendritic spines. Right, electron micrographs from the series showing, pseudocolored in green, two varicosities containing vesicles and mitochondria, but no indications of synaptic contacts. Electron micrographs were collected at the level of two varicosities highlighted by black arrows. (Scale bar, 0.5 μm.)
Fig. 5.
Fig. 5.
Role of GAP-43 in axonal plasticity. (A) Graphs compare the FDV and VUB for wild type (CTRL), GAP-43 silenced (siGAP; FDV = 6.3 ± 0.9% per day; VUB = −0.47 ± 0.81% per day; NVar = 486, NCF = 7), and siGAP laser axotomized CFs (siGAP + LA; FDV = 10.1 ± 1.5% per day; VUB = 0.22 ± 1.64% per day; NVar = 500, NCF = 6). *P < 0.05. (B) Graphs compare TB length (TBL) and motility (TBM) in wild type (CTRL), GAP-43 silenced CFs (siGAP; TBL = 7.6 ± 0.5 µm; NTB = 38, NCF = 6; TBM = 2.6 ± 0.2 µm; NTB = 89, NCF = 6) and siGAP laser axotomized CFs (siGAP + LA; TBL = 6.9 ± 0.7 µm; NTB = 53, NCF = 6; TBM = 2.8 ± 0.2 µm; NTB = 130, NCF = 6). (C) Time course of a CF in a siGAP animal displaying the degeneration of a CF (red arrowheads) after LA, but no sprouting. (Scale bar, 15 μm.) Graph compares the SF in SiGAP (SF = 1.3 ± 1.3%; NCF = 74, Nmice = 5) and siGAP laser axotomized (SF = 5 ± 5%; NCF = 9, Nmice = 6) CFs.

References

    1. Buonomano DV, Merzenich MM. Cortical plasticity: From synapses to maps. Annu Rev Neurosci. 1998;21:149–186. - PubMed
    1. Ruediger S, et al. Learning-related feedforward inhibitory connectivity growth required for memory precision. Nature. 2011;473(7348):514–518. - PubMed
    1. Tuszynski MH, Steward O. Concepts and methods for the study of axonal regeneration in the CNS. Neuron. 2012;74(5):777–791. - PMC - PubMed
    1. Horner PJ, Gage FH. Regenerating the damaged central nervous system. Nature. 2000;407(6807):963–970. - PubMed
    1. Snider WD, Zhou FQ, Zhong J, Markus A. Signaling the pathway to regeneration. Neuron. 2002;35(1):13–16. - PubMed

Publication types

MeSH terms

LinkOut - more resources