. 2013 Jun 18;110 Suppl 2(Suppl 2):10438-45.
doi: 10.1073/pnas.1301216110. Epub 2013 Jun 10.

Learning where to look for a hidden target

Affiliations

Learning where to look for a hidden target

Leanne Chukoskie et al. Proc Natl Acad Sci U S A. .

Abstract

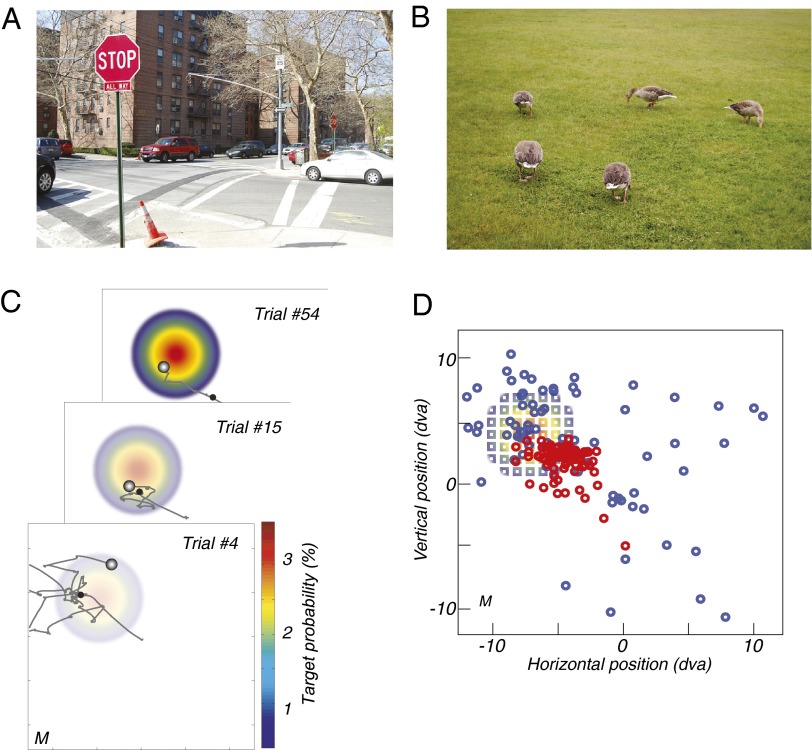
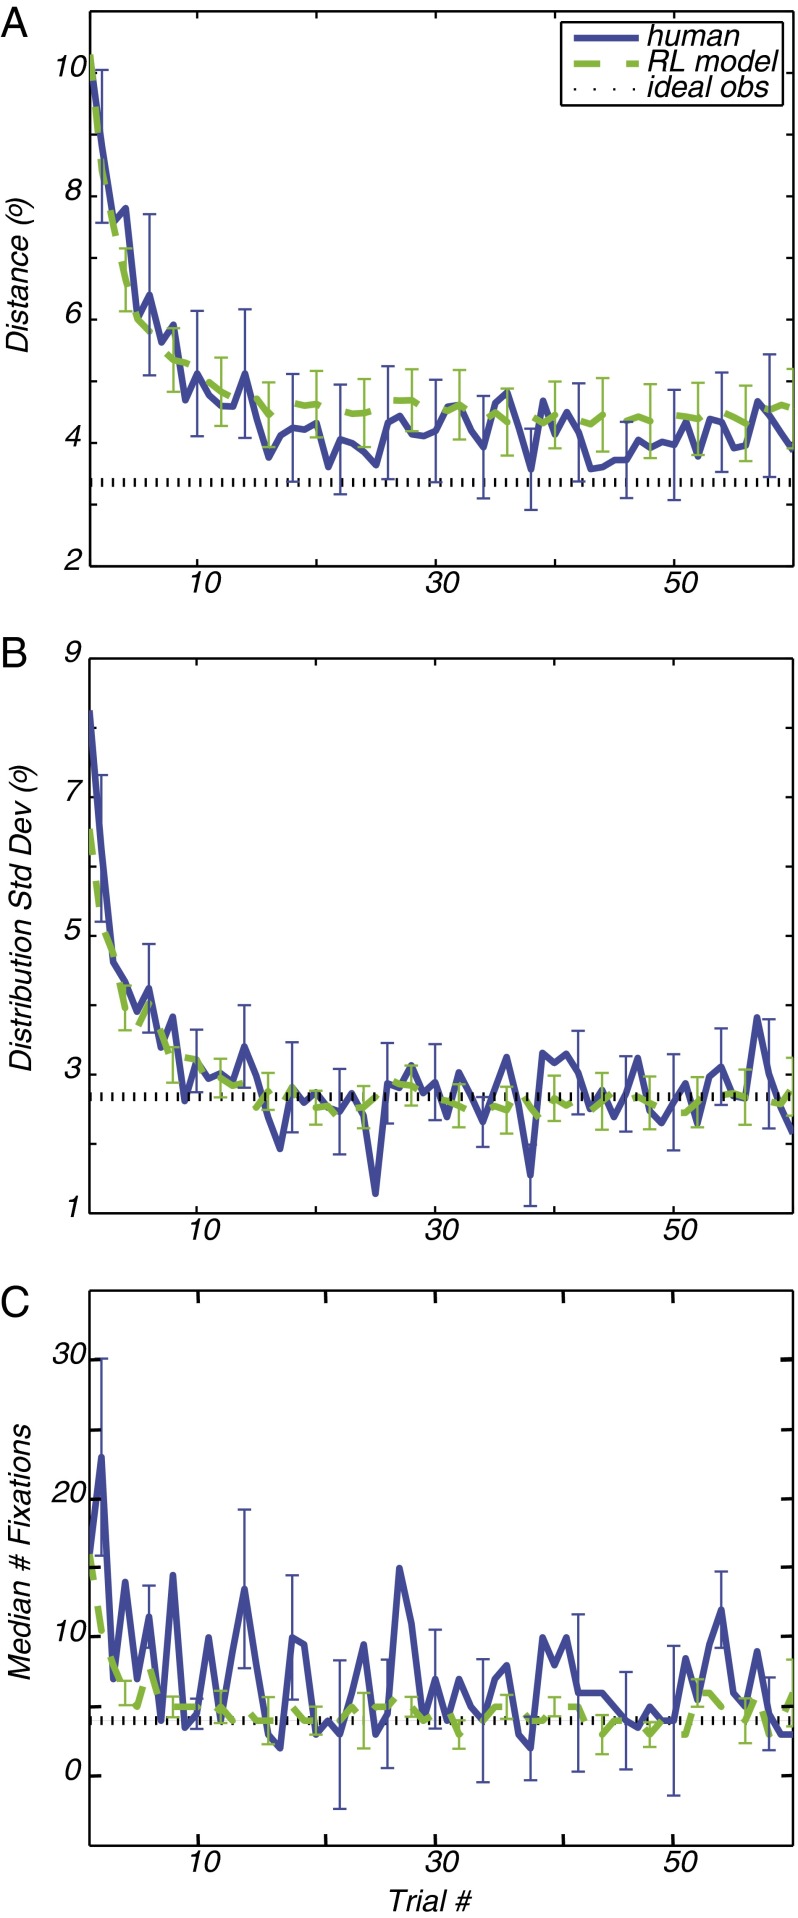
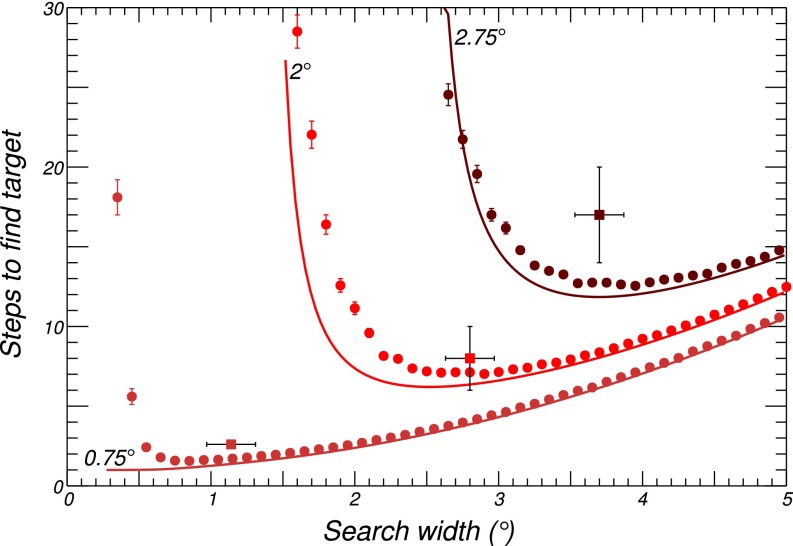
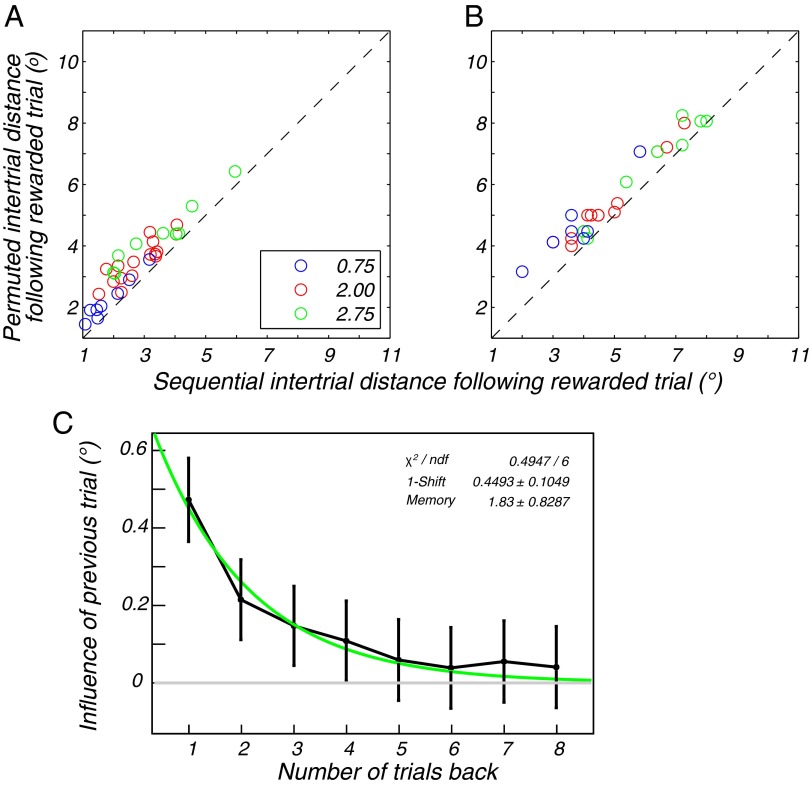
Survival depends on successfully foraging for food, for which evolution has selected diverse behaviors in different species. Humans forage not only for food, but also for information. We decide where to look over 170,000 times per day, approximately three times per wakeful second. The frequency of these saccadic eye movements belies the complexity underlying each individual choice. Experience factors into the choice of where to look and can be invoked to rapidly redirect gaze in a context and task-appropriate manner. However, remarkably little is known about how individuals learn to direct their gaze given the current context and task. We designed a task in which participants search a novel scene for a target whose location was drawn stochastically on each trial from a fixed prior distribution. The target was invisible on a blank screen, and the participants were rewarded when they fixated the hidden target location. In just a few trials, participants rapidly found the hidden targets by looking near previously rewarded locations and avoiding previously unrewarded locations. Learning trajectories were well characterized by a simple reinforcement-learning (RL) model that maintained and continually updated a reward map of locations. The RL model made further predictions concerning sensitivity to recent experience that were confirmed by the data. The asymptotic performance of both the participants and the RL model approached optimal performance characterized by an ideal-observer theory. These two complementary levels of explanation show how experience in a novel environment drives visual search in humans and may extend to other forms of search such as animal foraging.

Keywords: ideal observer; oculomotor; reinforcement learning; saccades.


Conflict of interest statement

The authors declare no conflict of interest.

Figures

Fig. 1.
Fig. 1.
Visible and hidden search tasks. (A) An experienced pedestrian has prior knowledge of where to look for signs, cars, and sidewalks in this street scene. (B) Ducks foraging in a large expanse of grass. (C) A representation of the screen is superimposed with the hidden target distribution that is learned over the session as well as sample eye traces from three trials for participant M. The first fixation of each trial is marked with a black circle. The final and rewarded fixation is marked by a shaded grayscale circle. (D) The region of the screen sampled with fixation shrinks from the entire screen on early trials (blue circles; 87 fixations over the first five trials) to a region that approximates the size and position of the Gaussian-integer distributed target locations (squares, color proportional to the probability as given in A) on later trials (red circles; 85 fixations from trials 32–39). Fixation position data are from participant M.
Fig. 2.
Fig. 2.
Learning curves for hidden-target search task. (A) The distance between the mean of the fixation cluster for each trial to the target centroid, averaged across participants, is shown in blue and green and indicates the result of 200 simulations of the reinforcement-learning model for each participant’s parameters. The SEM is given for both. The ideal-observer prediction is indicated by the black dotted line. (B) The SD of the eye position distributions or “search spread” is shown for the average of all participants (blue) and the RL model (green) with SEM. The dashed line is the ideal-observer theoretical optimum in each case, assuming perfect knowledge of the target distribution. (C) The median number of fixations made to find the target on each trial is shown (blue) along with the RL model prediction (green) of fixation number. The SEM is shown for both.
Fig. 3.
Fig. 3.
Optimal search model. Theoretical number of search steps to find the target for target distributions of size 0.75° (orange), 2° (red), and 2.75° (brown) was estimated by simulation (circles with mean and SEs from 100,000 trials per point) and from the theoretical calculation (solid lines) as detailed in Table S1 and Supporting Information. The simulation included the observed 1° bias seen in the subjects, but the theory lines did not. Solid boxes indicate the observed values for the subjects (mean and SE). With the added bias, the minimum moved slightly to the right but was only significant for the 0.75° target distribution. The cost in terms of extra saccades for nonoptimal search spreads (away from the minimum) was higher for the larger target distributions, and the comparatively shallow rise for search spreads above optimal meant that if subjects were to err, then they should tend toward larger spreads. Indeed, the tendency for larger spreads was evident as subjects started with large spreads and decreased toward the minimum (Fig. 2). The extra steps that subjects took to find the target for the 2.75° distribution (Upper Right) was consistent with the tendency toward small saccades even though they were quite close to the correct minimum (Fig. S2): The largest saccades may have been broken up into multiple short saccades.
Fig. 4.
Fig. 4.
Sequential effects in the human data and predictions of the RL model. (A) For each subject, we plot the mean sequential intertrial distance (the distance between the final fixation on trial n and the first fixation on trial n + 1 when trial n yields a reward) versus the permuted intertrial distance (the distance between the final fixation on a trial and the first fixation of another randomly drawn trial). Each circle denotes a subject, and the circle color indicates the target-spread condition (blue, σ = 0.75; red, σ = 2.00; green, σ = 2.75). Consistent with the model prediction (B), the sequential intertrial distance is reliably shorter than permuted intertrial distance, as indicated by the points lying above the diagonal. All intertrial distances are larger in the model, reflecting a greater degree of exploration than in the participants, but this mismatch is orthogonal to the sequential effects. (C) The effect of previous trials on search in the current trial is plotted as a function of the number of trials back. An exponential fit to the data are shown in green.
Fig. 5.
Fig. 5.
Length distributions of saccades in the hidden target task. A turning point algorithm applied to raw eye movement data yields a distribution of step sizes for all participants (Reinforcement Learning Model gives details). Very small “fixational” eye movements comprise the left side of the plot and large larger saccadic jumps on the right for three different sizes of target distribution. The points and lines (Loess fits with 95% confidence interval shading) for each search distribution size, all share a similar shape, particularly a bend at step sizes approaching 1° of visual angle.

References

    1. Potter MC. Meaning in visual search. Science. 1975;187(4180):965–966. - PubMed
    1. Itti L, Koch C. A saliency-based search mechanism for overt and covert shifts of visual attention. Vision Res. 2000;40(10-12):1489–1506. - PubMed
    1. Oliva A, Torralba A. Building the gist of a scene: The role of global image features in recognition. Prog Brain Res. 2006;155:23–36. - PubMed
    1. Torralba A, Oliva A, Castelhano MS, Henderson JM. Contextual guidance of eye movements and attention in real-world scenes: The role of global features in object search. Psychol Rev. 2006;113(4):766–786. - PubMed
    1. Neider MB, Zelinsky GJ. Scene context guides eye movements during visual search. Vision Res. 2006;46(5):614–621. - PubMed

Publication types

LinkOut - more resources