. 2013 Jul;56(3):275-83.
doi: 10.1007/s10858-013-9747-5. Epub 2013 Jun 11.

Fast and accurate fitting of relaxation dispersion data using the flexible software package GLOVE

Affiliations

Fast and accurate fitting of relaxation dispersion data using the flexible software package GLOVE

Kenji Sugase et al. J Biomol NMR. 2013 Jul.

Abstract

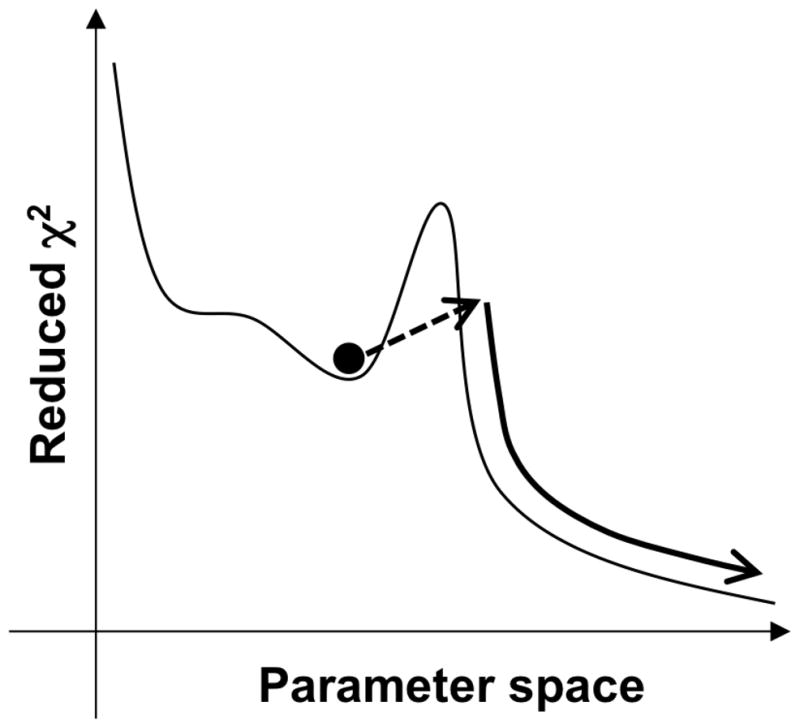
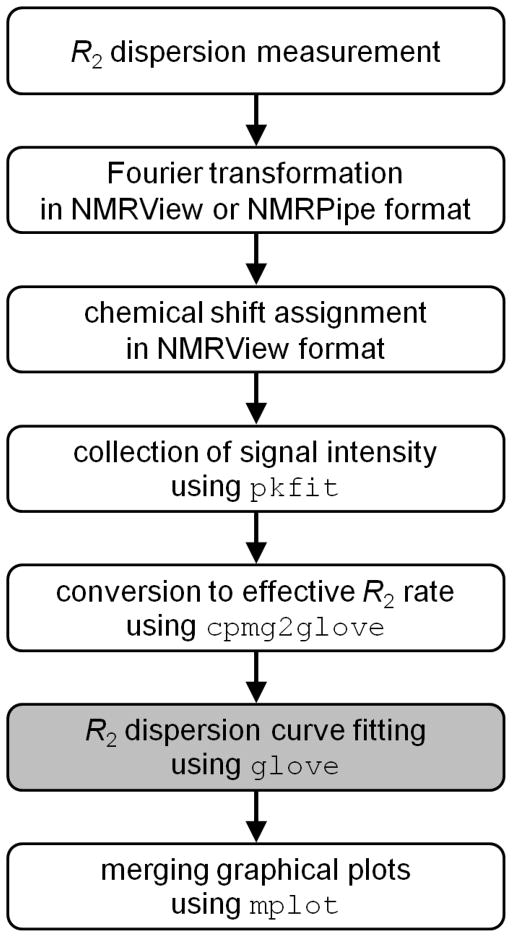
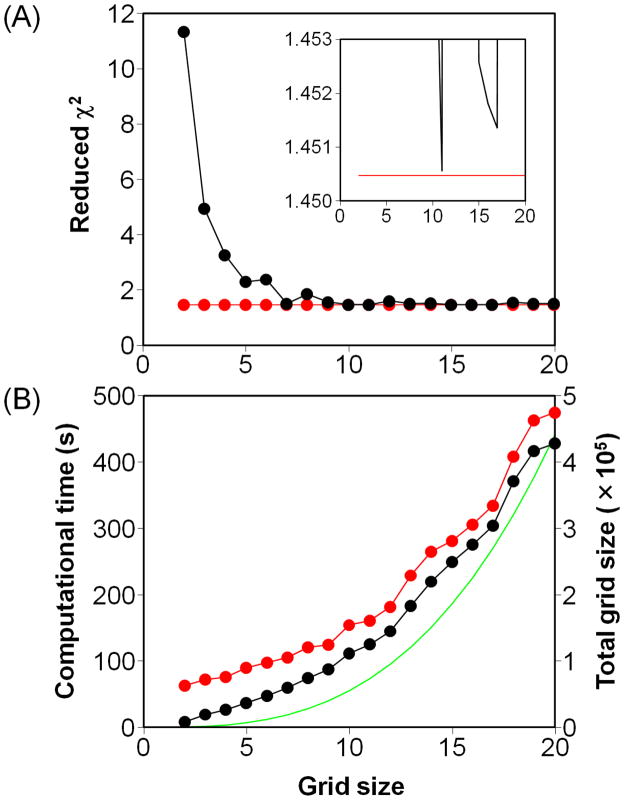
Relaxation dispersion spectroscopy is one of the most widely used techniques for the analysis of protein dynamics. To obtain a detailed understanding of the protein function from the view point of dynamics, it is essential to fit relaxation dispersion data accurately. The grid search method is commonly used for relaxation dispersion curve fits, but it does not always find the global minimum that provides the best-fit parameter set. Also, the fitting quality does not always improve with increase of the grid size although the computational time becomes longer. This is because relaxation dispersion curve fitting suffers from a local minimum problem, which is a general problem in non-linear least squares curve fitting. Therefore, in order to fit relaxation dispersion data rapidly and accurately, we developed a new fitting program called GLOVE that minimizes global and local parameters alternately, and incorporates a Monte-Carlo minimization method that enables fitting parameters to pass through local minima with low computational cost. GLOVE also implements a random search method, which sets up initial parameter values randomly within user-defined ranges. We demonstrate here that the combined use of the three methods can find the global minimum more rapidly and more accurately than grid search alone.


Figures

Figure 1
Figure 1
Schematic representation of the Monte-Carlo minimization method implemented in GLOVE. The dashed line arrow represents the Monte-Carlo process that adds random values to the current best fit parameters, enabling the parameters to pass through a local minimum. The reduced χ2 value usually increases in this step. The new parameter set is subsequently minimized as represented by the curved solid arrow.
Figure 2
Figure 2
Procedure for the analysis of relaxation dispersion data. The programs included in the GLOVE software package are shown in Courier New font. The main part of the data fitting using the GLOVE program, whose executable command is glove, is shown as the grey background.
Figure 3
Figure 3
Representative 15N relaxation dispersion profiles for KIX with the best-fit curves. The relaxation dispersion data were collected at 15N frequencies of 60.83 MHz (black line) and 76.01 MHz (red line). The plots were initially created by GLOVE for individual residues, and merged using mplot into a single PDF file. The numbers followed by “-HN” on the upper left of the plots are the residue number.
Figure 4
Figure 4
Fitting accuracy and speed using the grid search method. (A) The reduced χ2 values of the fits using the methods GRID (black) and GRID+ONEEX (red) plotted against the grid size. The inset is an enlarged view of the same plot. The symbols have been omitted for clarity. (B) The computational time for the fits using GRID (black) and GRID+ONEEX (red) plotted against the grid size. The vertical scale is shown on the left-hand side of the plot. The green line represents the total grid size Ntotal, whose vertical scale is shown on the right-hand side of the plot. Ntotal is calculated as: Ntotal=iNiglobaljkNj,klocal, where Niglobal and Nj,klocal represents the grid sizes of the i-th global parameter and the k-th local parameter in the j-th dataset, respectively.

References

    1. Bhabha G, Lee J, Ekiert DC, Gam J, Wilson IA, Dyson HJ, Benkovic SJ, Wright PE. A dynamic knockout reveals that conformational fluctuations influence the chemical step of enzyme catalysis. Science. 2011;332:234–238. - PMC - PubMed
    1. Bieri M, Gooley PR. Automated NMR relaxation dispersion data analysis using NESSY. BMC Bioinformatics. 2011;12:421. - PMC - PubMed
    1. Boehr DD, McElheny D, Dyson HJ, Wright PE. The dynamic energy landscape of dihydrofolate reductase Catalysis. Science. 2006;313:1638–1642. - PubMed
    1. Bouvignies G, Vallurupalli P, Hansen DF, Correia BE, Lange O, Bah A, Vernon RM, Dahlquist FW, Baker D, Kay LE. Solution structure of a minor and transiently formed state of a T4 lysozyme mutant. Nature. 2011;477:111–114. - PMC - PubMed
    1. Carver JP, Richards RE. A general two-site solution for the chemical exchange produced dependence of T2 upon the Carr-Pursell pulse separation. J Magn Reson. 1972;6:89–105.

Publication types

LinkOut - more resources