. 2014 Apr;14(7-8):820-828.
doi: 10.1002/pmic.201300046. Epub 2013 Jul 24.

Imaging mass spectrometry for assessing temporal proteomics: analysis of calprotectin in Acinetobacter baumannii pulmonary infection

Affiliations

Imaging mass spectrometry for assessing temporal proteomics: analysis of calprotectin in Acinetobacter baumannii pulmonary infection

Jessica L Moore et al. Proteomics. 2014 Apr.

Abstract

Imaging MS is routinely used to show spatial localization of proteins within a tissue sample and can also be employed to study temporal protein dynamics. The antimicrobial S100 protein calprotectin, a heterodimer of subunits S100A8 and S100A9, is an abundant cytosolic component of neutrophils. Using imaging MS, calprotectin can be detected as a marker of the inflammatory response to bacterial challenge. In a murine model of Acinetobacter baumannii pneumonia, protein images of S100A8 and S100A9 collected at different time points throughout infection aid in visualization of the innate immune response to this pathogen. Calprotectin is detectable within 6 h of infection as immune cells respond to the invading pathogen. As the bacterial burden decreases, signals from the inflammatory proteins decrease. Calprotectin is no longer detectable 96-144 h post infection, correlating to a lack of detectable bacterial burden in lungs. These experiments provide a label-free, multiplexed approach to study host response to a bacterial threat and eventual clearance of the pathogen over time.

Keywords: Acinetobacter baumannii; Calprotectin; Imaging MS; MALDI; Microbiology; Pulmonary infection.


Figures

Figure 1
Figure 1
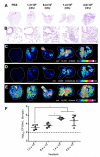
Levels of calprotectin in the lung increase as the bacterial challenge is increased. Seven-week-old mice were intranasally infected with varying doses of A. baumannii. (A) hematoxylin and eosin (H&E) stained serial sections of lung, (B) 40× magnification of areas with inflammation, (C) ion intensity map of m/z 10 165, S100A8, collected at 300 μm spatial resolution, (D) ion intensity map of m/z 12 999, sodiated S100A9, collected at 300 μm spatial resolution, (E) ion intensity map of m/z 14 050, histone H2A.1, (F) bacterial burden in the lungs of mice at each inoculum. The dashed line represents the detection limit. *p < 0.05 by ANOVA.
Figure 2
Figure 2
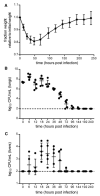
A. baumannii is rapidly cleared from sites of infection. Seven-week-old mice were intranasally infected with 108 CFUs A. baumannii and monitored over time in hours post infection (hpi) for (A) weight change. Values from 6 to 216 hpi were statistically decreased (p < 0.05) from uninfected animals by two-way ANOVA. (B) Bacterial burden in the lung, n = 5. Values from 0 to 72 hpi were statistically different (p < 0.05) from uninfected animals by Student’s t test. (C) Bacterial dissemination to the liver, n = 5. Values from 18 to 36 hpi were statistically different (p < 0.05) from uninfected animals by Student’s t test.
Figure 3
Figure 3
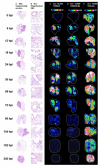
Calprotectin is recruited to sites of infection and signal decreases following bacterial clearance. Columns, left to right: (A) H&E stained serial sections of lung, (B) 40× magnification of areas with inflammation, (C) ion intensity map of m/z 10 165, S100A8 collected at 300 μm spatial resolution, (D) ion intensity map of m/z 12 999, sodiated S100A9 collected at 300 μm spatial resolution, and (E) ion intensity map of m/z 14 050, histone H2A.1 collected at 300 μm spatial resolution.
Figure 4
Figure 4
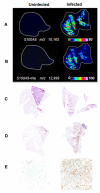
Histological comparison of atelectasis in inflamed lungs versus uninfected at 96 hpi. Lungs from 96 h time point. From left, PBS mock-infected and A. baumannii infected. (A) Ion intensity map of m/z 10 165, S100A8 at 300 μm lateral resolution. (B) Ion intensity map of m/z 12 999, sodiated S100A9 at 300 μm lateral resolution. (C) H&E stained sections of lung. (D) Immunohistochemistry stain for neutrophils. (E) 10× magnification of immunohistochemistry stain for neutrophils.
Figure 5
Figure 5
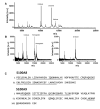
Identification of S100A8 and S100A9 from murine lung. Identification of S100A8 and S100A9: (A) Spectrum extracted from a single pixel of IMS data from the 48 hpi lung. (B) Spectra taken from selected fractions of HPLC fractionated homogenate, showing S100A8 (left) and S100A9 (right). (C) Sequence coverage for mouse S100A8 and S100A9 are shown. Underlined peptides were detected following recovery of the species of interest by offline HPLC fractionation, tryptic digestion, and subsequent LC-MS/MS analysis.

References

    1. Caprioli RM, Farmer TB, Gile J. Molecular imaging of biological samples: Localization of peptides and proteins using MALDI-TOF MS. Anal. Chem. 1997;69:4751–4760. - PubMed
    1. Nilsson A, Fehniger TE, Gustavsson L, Andersson M, et al. Fine mapping the spatial distribution and concentration of unlabeled drugs within tissue micro-compartments using imaging mass spectrometry. PLOS ONE. 2010;5:e11411. - PMC - PubMed
    1. Hsieh Y, Casale R, Chen J, Knemeyer I, et al. Matrix-assisted laser desorption/ionization imaging mass spectrometry for direct measurement of clozapine in rat brain tissue. Rapid Commun. Mass Spectrom. 20:965–972. - PubMed
    1. Cornett DS, Reyzer ML, Chaurand P, Caprioli RM. MALDI imaging mass spectrometry: molecular snapshots of biochemical systems. Nat. Methods. 2007;4:828–833. - PubMed
    1. Clemis EJ, Smith DS, Camenzind AG, Danell RM, et al. Quantitation of spatially-localized proteins in tissue samples using MALDI-MRM imaging. Anal. Chem. 2012;84:3514–3522. - PubMed

Publication types

MeSH terms

LinkOut - more resources