Review
. 2013 Jun 10;368(1622):20120383.
doi: 10.1098/rstb.2012.0383. Print 2013 Jul 19.

Energy, ecology and the distribution of microbial life

Affiliations
Review

Energy, ecology and the distribution of microbial life

Jennifer L Macalady et al. Philos Trans R Soc Lond B Biol Sci. .

Abstract

Mechanisms that govern the coexistence of multiple biological species have been studied intensively by ecologists since the turn of the nineteenth century. Microbial ecologists in the meantime have faced many fundamental challenges, such as the lack of an ecologically coherent species definition, lack of adequate methods for evaluating population sizes and community composition in nature, and enormous taxonomic and functional diversity. The accessibility of powerful, culture-independent molecular microbiology methods offers an opportunity to close the gap between microbial science and the main stream of ecological theory, with the promise of new insights and tools needed to meet the grand challenges humans face as planetary engineers and galactic explorers. We focus specifically on resources related to energy metabolism because of their direct links to elemental cycling in the Earth's history, engineering applications and astrobiology. To what extent does the availability of energy resources structure microbial communities in nature? Our recent work on sulfur- and iron-oxidizing autotrophs suggests that apparently subtle variations in the concentration ratios of external electron donors and acceptors select for different microbial populations. We show that quantitative knowledge of microbial energy niches (population-specific patterns of energy resource use) can be used to predict variations in the abundance of specific taxa in microbial communities. Furthermore, we propose that resource ratio theory applied to micro-organisms will provide a useful framework for identifying how environmental communities are organized in space and time.

Keywords: biogeochemistry; biogeography; ecological niche; environmental engineering; evolution; resource ratio theory.


Figures
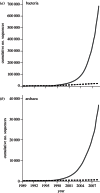
Figure 1.
Figure 1.
(a,b) Accumulation of biological sequence data in public databases originating from cultures versus environmental samples. Modified with permission from Pace [2]. Solid grey line denotes environmental; dashed line denotes cultured.
Figure 2.
Figure 2.
16S rRNA gene phylogenetic tree illustrating lineages that contain canonical and recently discovered ammonia oxidizing prokaryotes. Highly divergent biosignatures associated with each group are shown, including organic biomarkers and carbon fixation pathways resulting in organic matter with different C isotopic ratios. Although the relative dominance of ammonia oxidizers from these lineages in the environment is still under investigation, one of the principal factors controlling the distribution of Thaumarchaeota versus Proteobacteria appears to be ammonium (electron donor) concentrations [9]. The relative abundance of Planctomycetes that carry out anaerobic ammonia oxidation, or ‘annamox’, is strongly governed by the availability of oxygen (electron acceptor). C2, FCG1, FCG2, OP3, OP9, OP10, pMC1, pMC2, SAGMEG1, sediment-1, TM6, TM7, termite group I, and YNPFFA represent candidate divisions with few or no cultured representatives [2,4,5]. (Online version in colour.)
Figure 3.
Figure 3.
16S rRNA gene phylogenetic tree illustrating two lineages that contain extremely acidophilic iron-oxidizing lithoautotrophs. Niches and ecological successions between biomining and bioleaching micro-organisms can be at least partially explained by changes in iron availability [16]. OP3, OP9, OP10, TM6, TM7, and termite group I represent candidate divisions with few or no cultured representatives [2,4,5]. (Online version in colour.)
Figure 4.
Figure 4.
A natural iron oxide mound at Brubaker Run, Cambria County, PA (a), and an engineered ‘oxidation/precipitation channel’ at Dents Run, Elk County, PA (b). In both systems, the accumulation of Fe(III) minerals is due to low-pH Fe(II) oxidation by micro-organisms. (Online version in colour.)
Figure 5.
Figure 5.
16S rRNA gene phylogenetic tree illustrating lineages with representatives that harvest light energy using chlorophylls, i.e. chlorophototrophs, in green (not all members of these lineages are phototrophs). Reported photosynthetic electron donors are indicated by coloured dots. Pigment absorption spectra and carbon and nitrogen metabolism vary widely among phototrophs [46,47], indicating differential patterns of energy resource utilization at a variety of taxonomic scales. Notwithstanding significant evidence for lateral gene transfer among phototrophic lineages [48,49], some patterns of resource use are conserved within lineages that likely diverged billions of years ago [–52]. OP3, OP9, OP10, TM6, TM7 and termite group I represent candidate divisions with few or no cultured representatives [2,4,5]. (Online version in colour.)
Figure 6.
Figure 6.
Illustration showing the basic features of resource ratio theory most relevant for autotrophs (after [54,56]). The field represents a range of habitats described by variations in the supply rates of two essential limiting resources (resource 1 and resource 2). Two populations (A and B) are shown that may be selectively enriched as a result of resource availability. Lines A–A and B–B represent zero net growth isoclines (ZNGI) for populations A and B. ZNGIs represent combinations of resources where growth rate is equal to death rate for each population. Below and to the left, population growth is negative. Population sizes are constant on the ZNGI. In the white area, no growth is observed for either population. In the grey area (high ratio of resource 2: resource 1), population A dominates, while in the stippled area (low ratio of resource 2: resource 1), population B is dominant. Populations A and B coexist in the striped area. The dashed line indicates the change in community structure as a function of changes in resource ratios [54,56].
Figure 7.
Figure 7.
Correlation between dissolved sulfide : oxygen ratios and the abundance of cells hybridizing to a FISH (fluorescence in situ hybridization) probe targeting Sulfurovumales (filamentous Epsilonproteobacteria) in 12 biofilms from sulfidic cave groundwaters. Squares indicate biofilms with >50% Sulfurovumales biomass, whereas circles indicate biofilms dominated by Thiothrix populations. The black x (PCO5-11) represents a biofilm comprised primarily of as-yet unidentified micro-organisms (not Thiothrix or Sulfurovumales), which likely have a distinct intermediate energy niche. Modified from Macalady et al. [59]. (Online version in colour.)
Figure 8.
Figure 8.
Maximum-likelihood phylogram of 16S rRNA sequences showing relationships among Sulfurovumales (Epsilonproteobacteria) clones retrieved from geographically distant sulfidic groundwaters in Italy and USA. Populations highlighted in red are known to be the dominant populations in waters with sulfide : oxygen ratios more than 150. Neighbour joining (left) and maximum parsimony (right) bootstrap values greater than 50 are shown for each node. Reprinted from Jones et al. [60], with permission. (Online version in colour.)
Figure 9.
Figure 9.
Dominant iron-oxidizing acidophiles in n = 61 microbial communities from five AMD sites. Colours indicate three genus-level taxa common in the communities: Ferrovum, Gallionella-like and Acidithiobacillus. Symbol diameters are scaled to the percentage of the community represented by each genus as indicated by the key at lower right. Community compositions were determined using fluorescence in situ hybridization (FISH), informed by 16S rRNA gene cloning. Methods follow those described in Brown et al. [29]. (Online version in colour.)

References

    1. Carlson R. 2009. The new biofactories in what matters. McKinsey Quarterly New York, NY: McKinsey and Company; See http://whatmatters.mckinseydigital.com/biotechnology/the-new-biofactories.
    1. Pace NR. 2009. Mapping the tree of life: progress and prospects. Mol. Microbiol. Rev. 73, 565–57610.1128/MMBR.00033-09 (doi:10.1128/MMBR.00033-09) - DOI - DOI - PMC - PubMed
    1. Madsen EL. 2008. Environmental microbiology: from genomes to biogeochemistry. Malden, MA: Blackwell Publishing
    1. Hugenholtz P. 2002. Exploring prokaryotic diversity in the genomic era. Genome Biol. 3, 1–810.1186/gb-2002-3-2-reviews0003 (doi:10.1186/gb-2002-3-2-reviews0003) - DOI - DOI - PMC - PubMed
    1. Rappe MS, Giovannoni SJ. 2003. The uncultured microbial majority. Annu. Rev. Microbiol. 57, 369–39410.1146/annurev.micro.57.030502.090759 (doi:10.1146/annurev.micro.57.030502.090759) - DOI - DOI - PubMed

Publication types

LinkOut - more resources