. 2013;9(6):e1003408.
doi: 10.1371/journal.ppat.1003408. Epub 2013 Jun 6.

The systemic immune state of super-shedder mice is characterized by a unique neutrophil-dependent blunting of TH1 responses

Affiliations

The systemic immune state of super-shedder mice is characterized by a unique neutrophil-dependent blunting of TH1 responses

Smita Gopinath et al. PLoS Pathog. 2013.

Abstract

Host-to-host transmission of a pathogen ensures its successful propagation and maintenance within a host population. A striking feature of disease transmission is the heterogeneity in host infectiousness. It has been proposed that within a host population, 20% of the infected hosts, termed super-shedders, are responsible for 80% of disease transmission. However, very little is known about the immune state of these super-shedders. In this study, we used the model organism Salmonella enterica serovar Typhimurium, an important cause of disease in humans and animal hosts, to study the immune state of super-shedders. Compared to moderate shedders, super-shedder mice had an active inflammatory response in both the gastrointestinal tract and the spleen but a dampened T(H)1 response specific to the secondary lymphoid organs. Spleens from super-shedder mice had higher numbers of neutrophils, and a dampened T cell response, characterized by higher levels of regulatory T cells (T(regs)), fewer T-bet(+) (T(H)1) T cells as well as blunted cytokine responsiveness. Administration of the cytokine granulocyte colony stimulating factor (G-CSF) and subsequent neutrophilia was sufficient to induce the super-shedder immune phenotype in moderate-shedder mice. Similar to super-shedders, these G-CSF-treated moderate-shedders had a dampened T(H)1 response with fewer T-bet(+) T cells and a loss of cytokine responsiveness. Additionally, G-CSF treatment inhibited IL-2-mediated TH1 expansion. Finally, depletion of neutrophils led to an increase in the number of T-bet(+) T(H)1 cells and restored their ability to respond to IL-2. Taken together, we demonstrate a novel role for neutrophils in blunting IL-2-mediated proliferation of the TH1 immune response in the spleens of mice that are colonized by high levels of S. Typhimurium in the gastrointestinal tract.


Conflict of interest statement

The authors have declared that no competing interests exist.

Figures

Figure 1
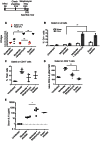
Figure 1. High fecal bacterial load is associated with systemic neutrophilia.
All infections were conducted for 30 days unless otherwise indicated. A: Bacterial burden of indicated organs was quantified. B: Gr1+ cells are represented as a percentage of total cells of a single cell suspension of indicated organs. Data from at least three and a maximum of four mice per condition are shown. All differences between super-shedders, moderate-shedders and uninfected mice are significant with p<0.05 calculated using the Mann-Whitney U test, two-tailed. C: Cytospins were prepared from splenocytes of a representative super-shedder mouse infected for 30 days. A 1000 count differential was performed to identify the myeloid cell composition of the super-shedder spleen. These data are averaged across 4 mice and are representative of experiments including a total of 15 mice.
Figure 2
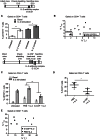
Figure 2. High fecal bacterial load is associated with dampened splenic T cell response.
A–E: Twelve mice are represented and data is representative of 3 independent experiments with a total of 30 mice. Each circle represents an individual mouse. Asterisks indicate significant R values determined using Spearman's correlation, two-tailed. C–F: Each point represents a single mouse with red and orange dots representing super-shedders as confirmed by cecal and colonic inflammation. A,B: Tbet+ (TH1) and FoxP3+ (Tregs) CD4 T cells were measured as a percentage of total CD4 T cells in the spleen. Neutrophils were measured as a percentage of total splenocytes. Splenic TH1 and Tregs were significantly negatively correlated with a R value of −0.58*. Fecal bacterial load was negatively correlated with splenic TH1 (R = −0.49) and significantly positively correlated with splenic Tregs (R = +0.65*). Finally, splenic neutrophils were significantly positively correlated with fecal bacterial load (R = +0.9*) and negatively correlated with TH1 cells (R = −0.43). C: Splenocytes were stimulated ex vivo for 15 minutes with 40 ng/ml IL-2. IL-2 responsive pSTAT5+ CD4 T cells were gated and the mean fluorescence intensity (MFI) of pSTAT5 measured. D: Ki-67+ cells were quantified as a percentage of total CD4 T cells and plotted against fecal bacterial burden of the mice. E : Splenocytes were stimulated ex vivo for 15 minutes with 40 ng/ml IL-6. pSTAT1 MFI of naïve CD4 T cells is represented on the y axis. F: Circulating levels of IL-6 was measured in the serum of 10 mice in a different experiment and plotted against fecal bacterial burden. Fecal shedding was significantly positively correlated with an R value of +0.63*. This was repeated twice with a total of 20 mice.
Figure 3
Figure 3. Streptomycin treatment induces the super-shedder phenotype in the gastrointestinal tract and the spleen.
Mice were identified as moderate (<106 cfu/gm) or super-shedder (>108 cfu/gm) between day 15 and day 30 post infection. At 30 days post infection, they were treated with a single dose of 5 mg streptomycin via oral gavage and sacrificed three days after treatment. Data shown is representative of 2 independent experiments with a total of 8–10 mice in each condition. Significance was determined using a two-tailed Mann-Whitney U test with one asterisk representing p<0.05 and two representing a p<0.01. A: Bacterial burden was quantified in the spleen (red) and feces (black). B: Gr1+ cells are presented as the percentage of total cells in the spleen and the colon. C. Tbet+ TH1 cells were quantified as percentage of total CD4+T cells. D. Splenocytes were stimulated with IL-6 for 15 minutes ex vivo, fixed and permeabilized and phosphoSTAT1 expression of total CD4 T cells quantified. E. Serum IL-6 levels measured by ELISA.
Figure 4
Figure 4. Neutrophil depletion results in increased CD4 pSTAT5 and Tbet expression.
After 30 days of infection, mice were injected with 1 µg RB6 depletion antibody every day for 3 days and sacrificed on the 4th day. Data shown is representative of 2 independent experiments with a total of 8–10 mice in each condition. Significance was determined using a Two-tailed Mann-Whitney U test with one asterisk representing p<0.05 and two representing a p<0.01. A: Tbet+ CD4 T (TH1) cells from splenocytes were quantified as a percentage of CD4 T cells. B: Splenocytes were stimulated ex vivo with 40 ng/ml IL-2 and fixed and permeabilized and total CD4 T cell pSTAT5 MFI measured. C: FoxP3+ CD4 T cells (Tregs) were quantified as a percentage of CD4 T cells. D: Fecal pellets were collected and bacterial burden quantified.
Figure 5
Figure 5. G-CSF treatment mimics the splenic super-shedder immune phenotype.
Mice were identified as moderate (<106 cfu/gm) or super-shedder (>108 cfu/gm) between day 15 and day 30 post infection. Moderate shedders were injected with 1 µg G-CSF per day for three days and sacrificed on the 4th day. Data shown is representative of 2 independent experiments with a total of 8–10 mice in each condition. Significance was determined using a two-tailed Mann-Whitney U test with one asterisk representing p<0.05 and two representing a p<0.01. A: Splenic Gr1+ cells are represented as a percentage of total cells in G-CSF- and PBS-treated control mice. B: Tbet+ TH1 cells from splenocytes were quantified as a percentage of CD4 T cells. C, D: Splenocytes were stimulated ex vivo for 15 minutes with 40 ng/ml of IL-6 and IL-2 and total CD4 T cell pSTAT1 and pSTAT5 MFI measured. E: Fecal bacterial burden was quantified.
Figure 6
Figure 6. G-CSF treatment mimics the super-shedder phenotype by inhibiting IL-2 mediated TH1 expansion.
A,B: Mice were identified as moderate (<106 cfu/gm) or super-shedder (>108 cfu/gm) between day 15 and day 30 post infection. After 30 days of infection, mice were injected with 15 µg IL-2 antibody complexed with 4.5 µg IL-2 cytokine in a 15 minute incubation period at room temperature. Data shown is from a single experiment with a total of 12 mice, 4 untreated and 8 treated. A: Splenocytes were fixed and permeabilized and pSTAT5 MFI quantified in all CD4 T cells. B: TH1 and Treg levels were expressed as a percentage of total splenic CD4 T cells. Untreated mice (in square) showed no expansion and IL-2 antibody complex- treated mice included both super-shedders (open circles) and moderate-shedders (filled circles). IL-2 mediated TH1 expansion was significantly lower in super-shedder mice (p = 0.02), calculated using a one-tailed Mann Whitney U test. C, D, E: Moderate shedders were treated with either G-CSF or PBS for 3 days and then injected with IL-2 antibody complex on the 4th day. Mice were sacrificed on the 6th day, 36 days post-infection. Data shown is representative of 2 independent experiments with a total of 8 mice in each condition. Significance was determined using a two-tailed Mann-Whitney U test with one asterisk representing p<0.05 and two representing p<0.01. C: Splenocytes were stimulated ex vivo with 40 ng/ml IL-2 for 15 minutes and fixed and permeabilized and the frequency of pSTAT5+ CD4 T cells was quantified. D: Splenocytes were fixed and Ki-67+ CD4 T cells were quantified as a percentage of total CD4 T cells. E: TH1 and Treg levels were expressed as a percentage of total splenic CD4 T cells in G-CSF treated mice (open squares) and control mice (closed squares). TH1 cells were significantly lower in the G-CSF pretreated mice (p = 0.02) calculated using a two-tailed Mann Whitney U test.
Figure 7
Figure 7. Neutrophils control the dampened systemic TH1 response of super-shedders.
In super-shedders, high levels of Salmonella in the gastrointestinal tract induce systemic neutrophilia with extensive granulopoiesis occurring in the bone marrow, resulting in elevated neutrophil counts in the blood, GI tract and spleen. This is accompanied by dampened IL-2 and IL-6 cytokine responsiveness in splenic CD4 T cells, fewer TH1 cells and more Tregs. In moderate shedders, low levels of gastrointestinal Salmonella induce very few neutrophils systemically, leading to an active IL-2 and IL-6 response with increased TH1 cells and fewer Tregs. Induction of granulopoiesis in moderate-shedders results in the super-shedder immune phenotype with the exception of Tregs, which remain unchanged.

References

    1. Woolhouse ME, Dye C, Etard JF, Smith T, Charlwood JD, et al. (1997) Heterogeneities in the transmission of infectious agents: implications for the design of control programs. Proc Natl Acad Sci USA 94: 338–342. - PMC - PubMed
    1. Matthews L, McKendrick IJ, Terent H, Gunn GJ, Synge B, et al. (2005) Super-shedding cattle and the transmission dynamics of Escherichia coli O157. Epidemiol Infect 134: 131 doi:10.1017/S0950268805004590 - DOI - PMC - PubMed
    1. Chase-Topping ME, McKendrick IJ, Pearce MC, MacDonald P, Matthews L, et al. (2007) Risk Factors for the Presence of High-Level Shedders of Escherichia coli O157 on Scottish Farms. J Clin Microbiol 45: 1594–1603 doi:10.1128/JCM.01690-06 - DOI - PMC - PubMed
    1. Chase-Topping M, Gally D, Low C, Matthews L, Woolhouse M (2008) Super-shedding and the link between human infection and livestock carriage of Escherichia coli O157. Nat Rev Micro 6: 904–912 doi:10.1038/nrmicro2029 - DOI - PMC - PubMed
    1. Stein RA (2011) Super-spreaders in infectious diseases. Int J Infect Dis 15: e510–e513 doi:10.1016/j.ijid.2010.06.020 - DOI - PMC - PubMed

Publication types

Substances