

H3.3-H4 tetramer splitting events feature cell-type specific enhancers
- PMID: 23754967
- PMCID: PMC3675017
- DOI: 10.1371/journal.pgen.1003558
H3.3-H4 tetramer splitting events feature cell-type specific enhancers
Abstract
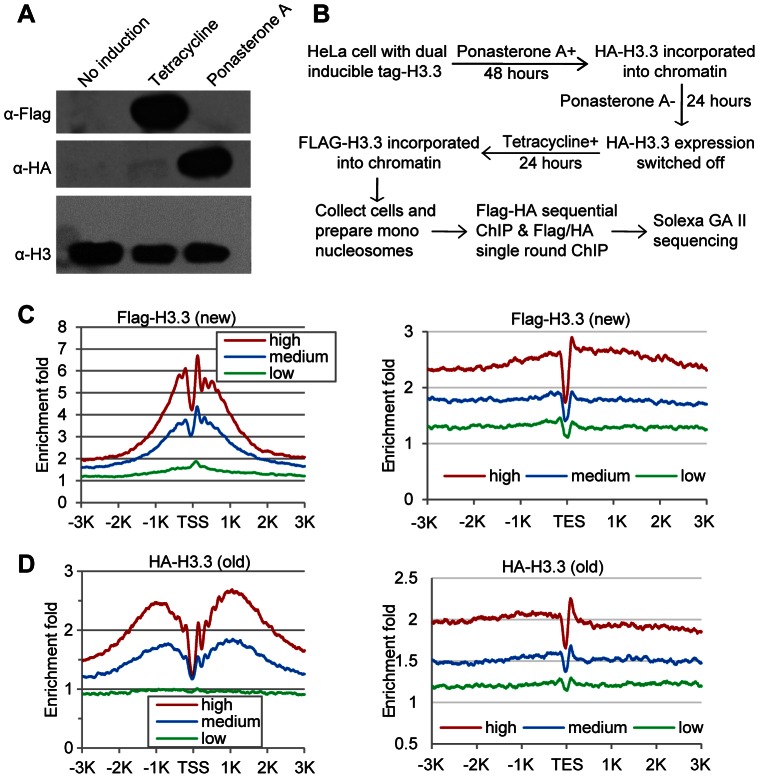
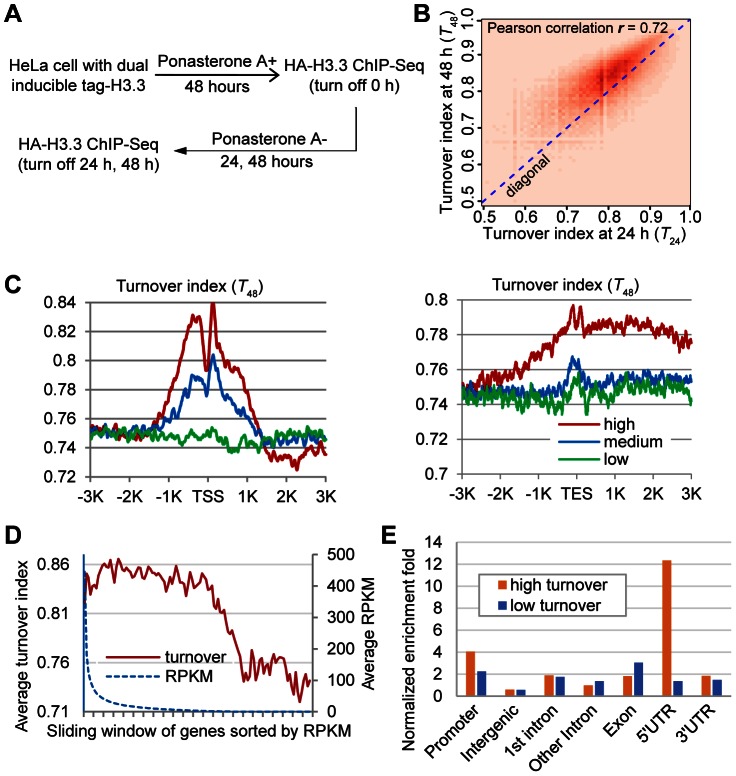
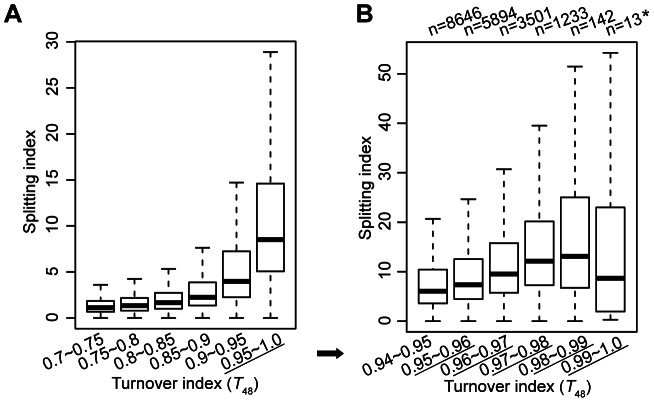
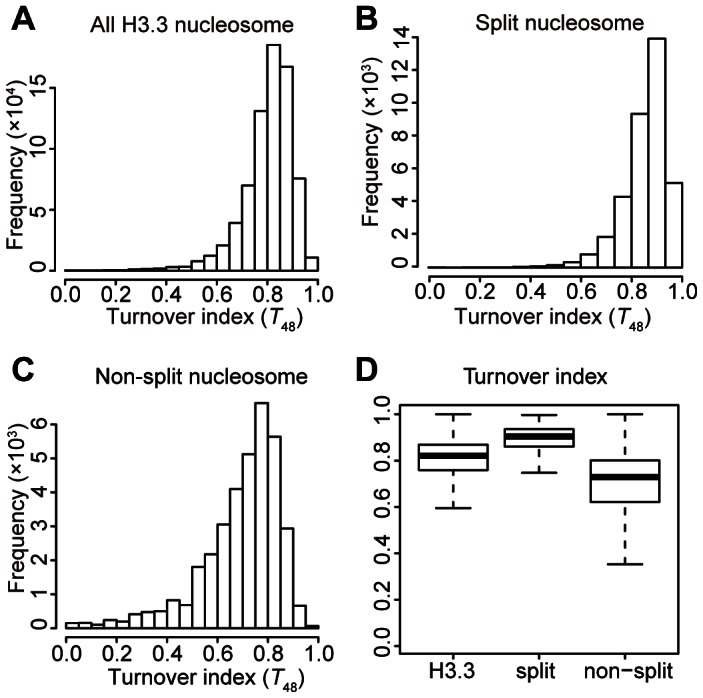
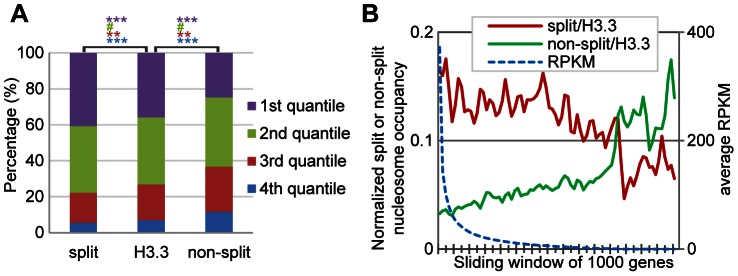
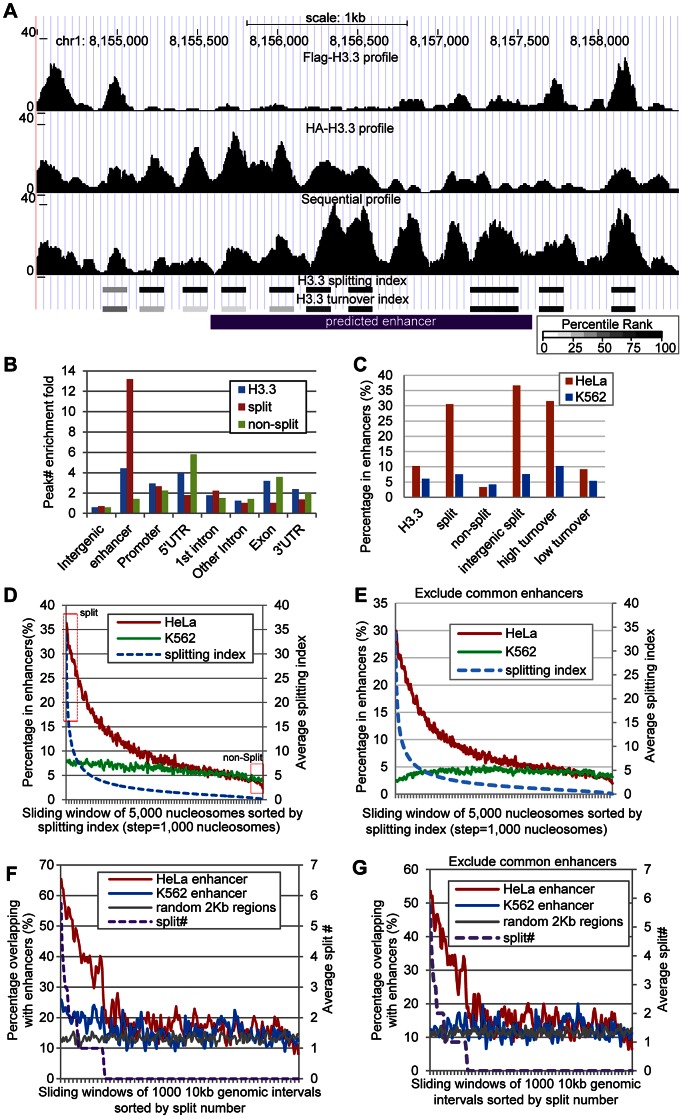
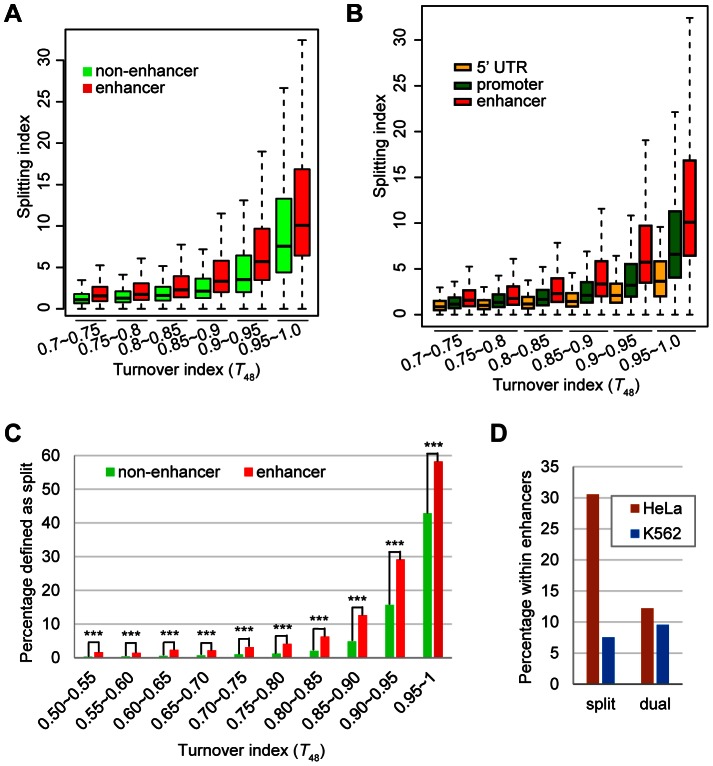
Previously, we reported that little canonical (H3.1-H4)(2) tetramers split to form "hybrid" tetramers consisted of old and new H3.1-H(4) dimers, but approximately 10% of (H3.3-H4)2 tetramers split during each cell cycle. In this report, we mapped the H3.3 nucleosome occupancy, the H3.3 nucleosome turnover rate and H3.3 nucleosome splitting events at the genome-wide level. Interestingly, H3.3 nucleosome turnover rate at the transcription starting sites (TSS) of genes with different expression levels display a bimodal distribution rather than a linear correlation towards the transcriptional activity, suggesting genes are either active with high H3.3 nucleosome turnover or inactive with low H3.3 nucleosome turnover. H3.3 nucleosome splitting events are enriched at active genes, which are in fact better markers for active transcription than H3.3 nucleosome occupancy itself. Although both H3.3 nucleosome turnover and splitting events are enriched at active genes, these events only display a moderate positive correlation, suggesting H3.3 nucleosome splitting events are not the mere consequence of H3.3 nucleosome turnover. Surprisingly, H3.3 nucleosomes with high splitting index are remarkably enriched at enhancers in a cell-type specific manner. We propose that the H3.3 nucleosomes at enhancers may be split by an active mechanism to regulate cell-type specific transcription.
Conflict of interest statement
The authors have declared that no competing interests exist.
Figures
Similar articles
-
Splitting of H3-H4 tetramers at transcriptionally active genes undergoing dynamic histone exchange.Proc Natl Acad Sci U S A. 2011 Jan 25;108(4):1296-301. doi: 10.1073/pnas.1018308108. Epub 2011 Jan 10. Proc Natl Acad Sci U S A. 2011. PMID: 21220302 Free PMC article.
-
Partitioning of histone H3-H4 tetramers during DNA replication-dependent chromatin assembly.Science. 2010 Apr 2;328(5974):94-8. doi: 10.1126/science.1178994. Science. 2010. PMID: 20360108
-
In vivo effects of histone H3 depletion on nucleosome occupancy and position in Saccharomyces cerevisiae.PLoS Genet. 2012;8(6):e1002771. doi: 10.1371/journal.pgen.1002771. Epub 2012 Jun 21. PLoS Genet. 2012. PMID: 22737086 Free PMC article.
-
How is epigenetic information on chromatin inherited after DNA replication?Ernst Schering Res Found Workshop. 2006;(57):89-96. doi: 10.1007/3-540-37633-x_5. Ernst Schering Res Found Workshop. 2006. PMID: 16568950 Review.
-
All roads lead to chromatin: multiple pathways for histone deposition.Biochim Biophys Acta. 2013 Mar-Apr;1819(3-4):238-46. Biochim Biophys Acta. 2013. PMID: 24459726 Review.
Cited by
-
Preferential Phosphorylation on Old Histones during Early Mitosis in Human Cells.J Biol Chem. 2016 Jul 15;291(29):15342-57. doi: 10.1074/jbc.M116.726067. Epub 2016 May 19. J Biol Chem. 2016. PMID: 27226594 Free PMC article.
-
Histone exchange, chromatin structure and the regulation of transcription.Nat Rev Mol Cell Biol. 2015 Mar;16(3):178-89. doi: 10.1038/nrm3941. Epub 2015 Feb 4. Nat Rev Mol Cell Biol. 2015. PMID: 25650798 Review.
-
The patterns and participants of parental histone recycling during DNA replication in Saccharomyces cerevisiae.Sci China Life Sci. 2023 Jul;66(7):1600-1614. doi: 10.1007/s11427-022-2267-6. Epub 2023 Mar 9. Sci China Life Sci. 2023. PMID: 36914923
-
Structure and function of the histone chaperone FACT - Resolving FACTual issues.Biochim Biophys Acta Gene Regul Mech. 2018 Jul 25:S1874-9399(18)30159-7. doi: 10.1016/j.bbagrm.2018.07.008. Online ahead of print. Biochim Biophys Acta Gene Regul Mech. 2018. PMID: 30055319 Free PMC article. Review.
-
Histone H3K27 acetylation is dispensable for enhancer activity in mouse embryonic stem cells.Genome Biol. 2020 Feb 21;21(1):45. doi: 10.1186/s13059-020-01957-w. Genome Biol. 2020. PMID: 32085783 Free PMC article.
References
-
- Sarma K, Reinberg D (2005) Histone variants meet their match. Nature reviews Molecular cell biology 6: 139–149. - PubMed
-
- Yuan G, Zhu B (2012) Histone variants and epigenetic inheritance. Biochimica et biophysica acta 1819: 222–229. - PubMed
-
- Ahmad K, Henikoff S (2002) The histone variant H3.3 marks active chromatin by replication-independent nucleosome assembly. Mol Cell 9: 1191–1200. - PubMed
Publication types
MeSH terms
Substances
Grants and funding
LinkOut - more resources
Full Text Sources
Other Literature Sources
Research Materials
