

KCC2-dependent subcellular E(Cl) difference of ON-OFF retinal ganglion cells in larval zebrafish
- PMID: 23754987
- PMCID: PMC3664767
- DOI: 10.3389/fncir.2013.00103
KCC2-dependent subcellular E(Cl) difference of ON-OFF retinal ganglion cells in larval zebrafish
Abstract
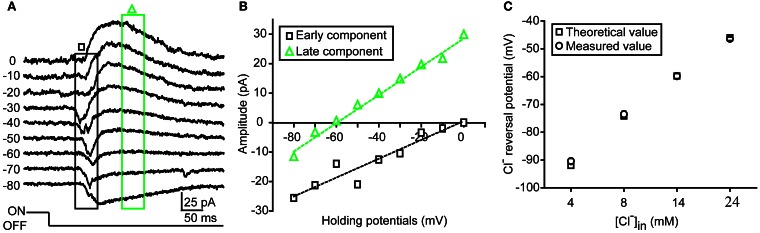
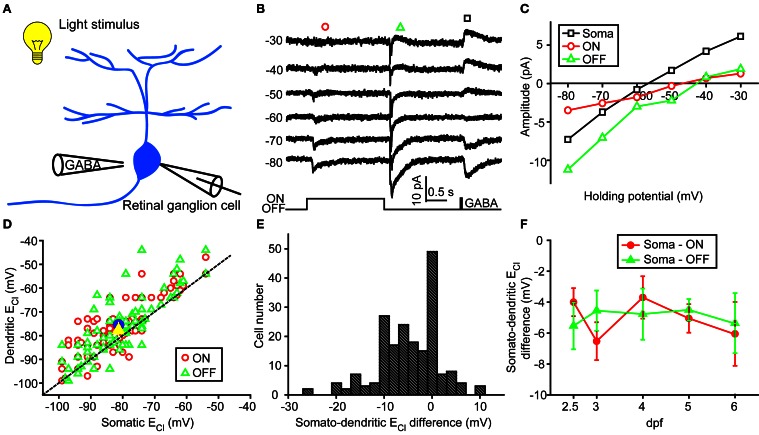
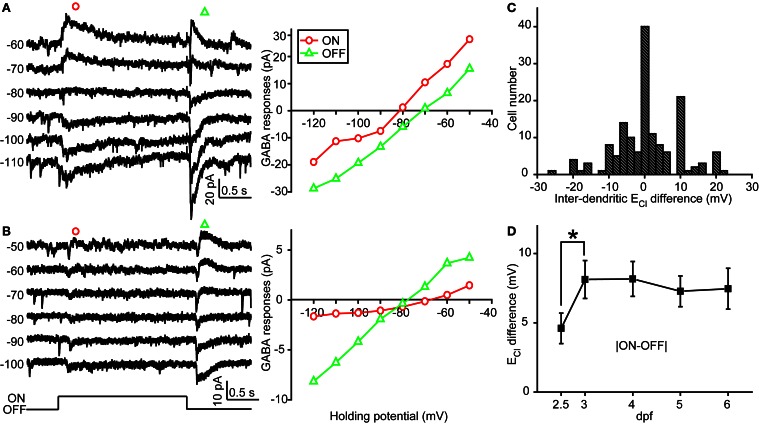
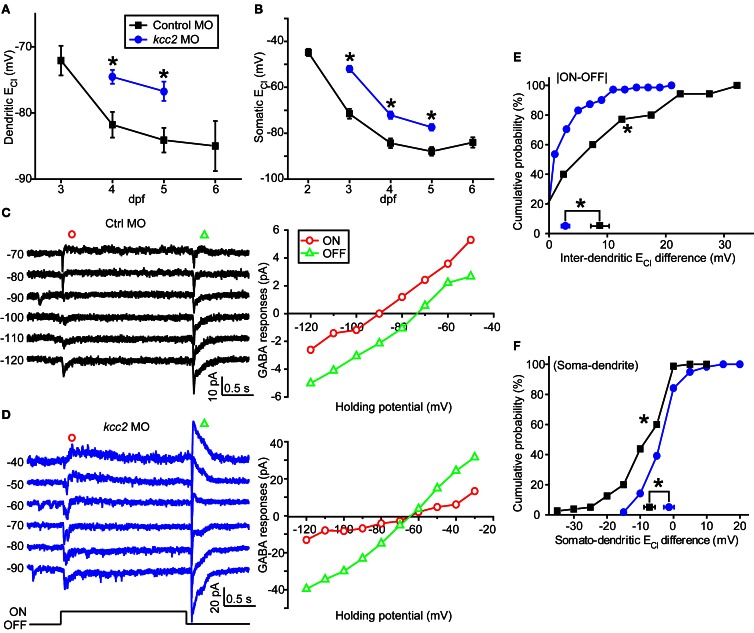
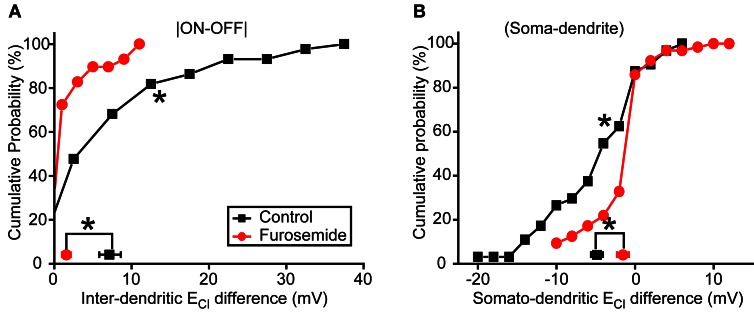
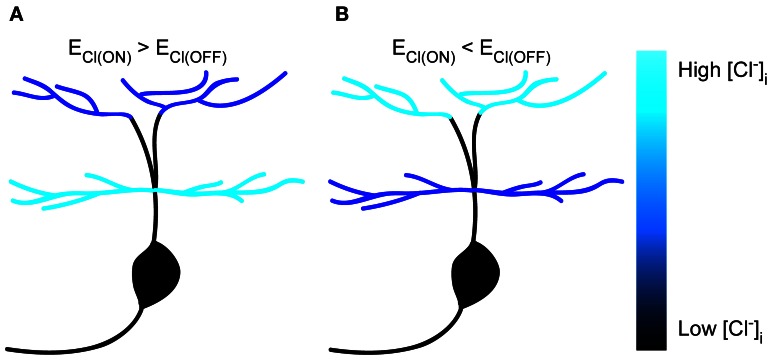
Subcellular difference in the reversal potential of Cl(-) (ECl) has been found in many types of neurons. As local ECl largely determines the action of nearby GABAergic/glycinergic synapses, subcellular ECl difference can effectively regulate neuronal computation. The ON-OFF retinal ganglion cell (RGC) processes both ON and OFF visual signals via its ON and OFF dendrites, respectively. It is thus interesting to investigate whether the ON and OFF dendrites of single RGCs exhibit different local ECl. Here, using in vivo gramicidin-perforated patch recording in larval zebrafish ON-OFF RGCs, we examine local ECl at the ON and OFF dendrites, and soma through measuring light-evoked ON and OFF inhibitory responses, and GABA-induced response at the soma, respectively. We find there are subcellular ECl differences between the soma and dendrite, as well as between the ON and OFF dendrites of single RGCs. These somato-dendritic and inter-dendritic ECl differences are dependent on the Cl(-) extruder, K(+)/Cl(-) co-transporter (KCC2), because they are largely diminished by down-regulating kcc2 expression with morpholino oligonucleotides (MOs) or by blocking KCC2 function with furosemide. Thus, our findings indicate that there exists KCC2-dependent ECl difference between the ON and OFF dendrites of individual ON-OFF RGCs that may differentially affect visual processing in the ON and OFF pathways.
Keywords: Cl− reversal potential; GABA; KCC2; in vivo whole-cell recording; retinal ganglion cells; subcellular; zebrafish.
Figures
Similar articles
-
Development of light response and GABAergic excitation-to-inhibition switch in zebrafish retinal ganglion cells.J Physiol. 2010 Jul 15;588(Pt 14):2557-69. doi: 10.1113/jphysiol.2010.187088. Epub 2010 May 24. J Physiol. 2010. PMID: 20498234 Free PMC article.
-
In vivo development of dendritic orientation in wild-type and mislocalized retinal ganglion cells.Neural Dev. 2010 Nov 2;5:29. doi: 10.1186/1749-8104-5-29. Neural Dev. 2010. PMID: 21044295 Free PMC article.
-
Cell type-specific differences in chloride-regulatory mechanisms and GABA(A) receptor-mediated inhibition in rat substantia nigra.J Neurosci. 2003 Sep 10;23(23):8237-46. doi: 10.1523/JNEUROSCI.23-23-08237.2003. J Neurosci. 2003. PMID: 12967985 Free PMC article.
-
Development of On and Off retinal pathways and retinogeniculate projections.Prog Retin Eye Res. 2004 Jan;23(1):31-51. doi: 10.1016/j.preteyeres.2003.10.001. Prog Retin Eye Res. 2004. PMID: 14766316 Review.
-
The Multifaceted Roles of KCC2 in Cortical Development.Trends Neurosci. 2021 May;44(5):378-392. doi: 10.1016/j.tins.2021.01.004. Epub 2021 Feb 24. Trends Neurosci. 2021. PMID: 33640193 Review.
Cited by
-
Unraveling the socio-cognitive consequences of KCC2 disruption in zebrafish: implications for neurodevelopmental disorders and therapeutic interventions.Front Mol Neurosci. 2024 Oct 14;17:1483238. doi: 10.3389/fnmol.2024.1483238. eCollection 2024. Front Mol Neurosci. 2024. PMID: 39469188 Free PMC article.
-
Active cortical networks promote shunting fast synaptic inhibition in vivo.Neuron. 2023 Nov 15;111(22):3531-3540.e6. doi: 10.1016/j.neuron.2023.08.005. Epub 2023 Sep 1. Neuron. 2023. PMID: 37659408 Free PMC article.
-
Cation-chloride cotransporters in neuronal development, plasticity and disease.Nat Rev Neurosci. 2014 Oct;15(10):637-54. doi: 10.1038/nrn3819. Nat Rev Neurosci. 2014. PMID: 25234263 Free PMC article. Review.
References
-
- Gao F., Wu S. M. (1998). Characterization of spontaneous inhibitory synaptic currents in salamander retinal ganglion cells. J. Neurophysiol. 80, 1752–1764 - PubMed
Publication types
MeSH terms
Substances
LinkOut - more resources
Full Text Sources
Other Literature Sources
Molecular Biology Databases
Research Materials
Miscellaneous