. 2013 May 31:5:5.
doi: 10.3389/fnene.2013.00005. eCollection 2013.

Glucose and lactate metabolism in the awake and stimulated rat: a (13)C-NMR study

Affiliations

Glucose and lactate metabolism in the awake and stimulated rat: a (13)C-NMR study

Denys Sampol et al. Front Neuroenergetics. .

Abstract

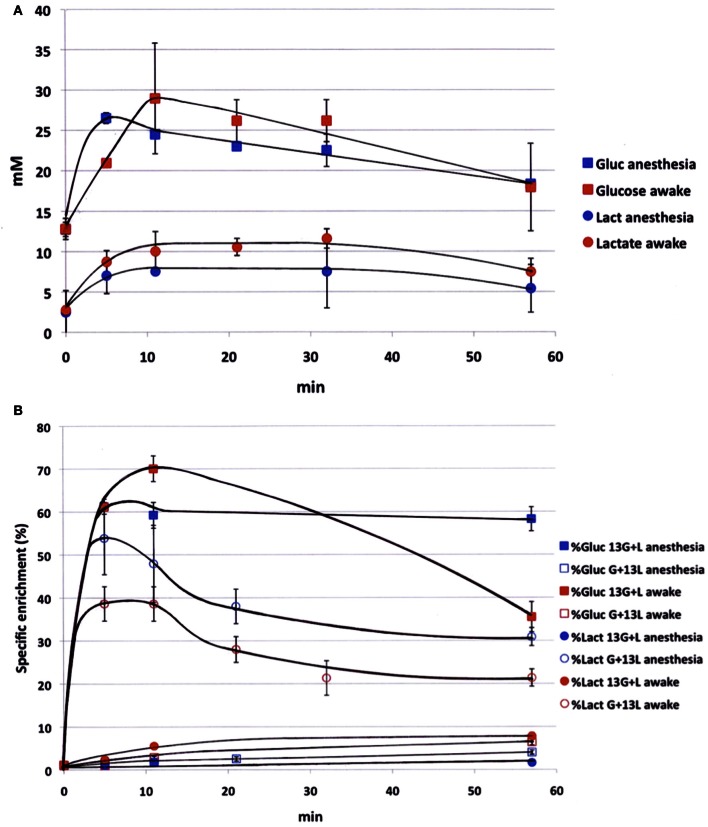
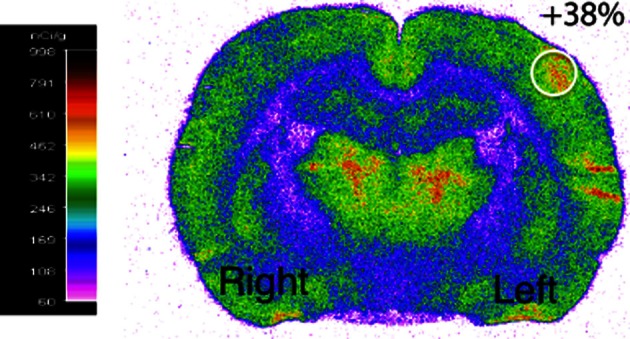
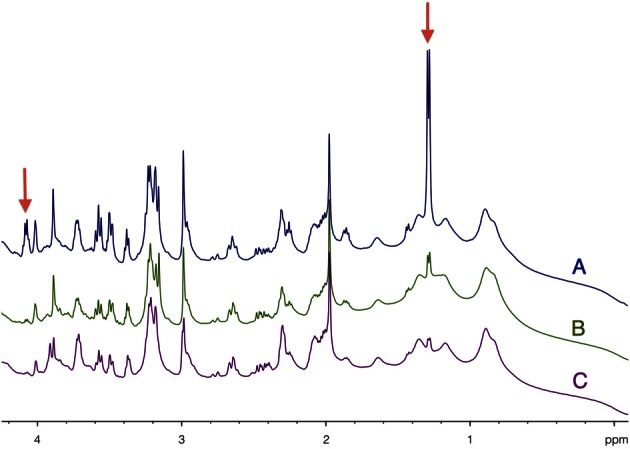
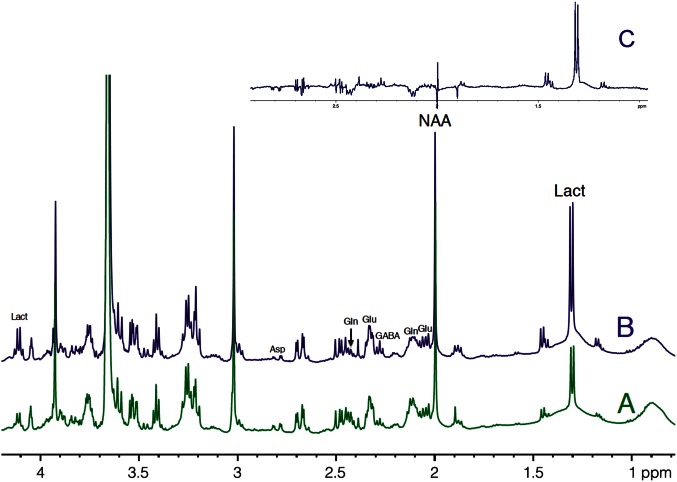
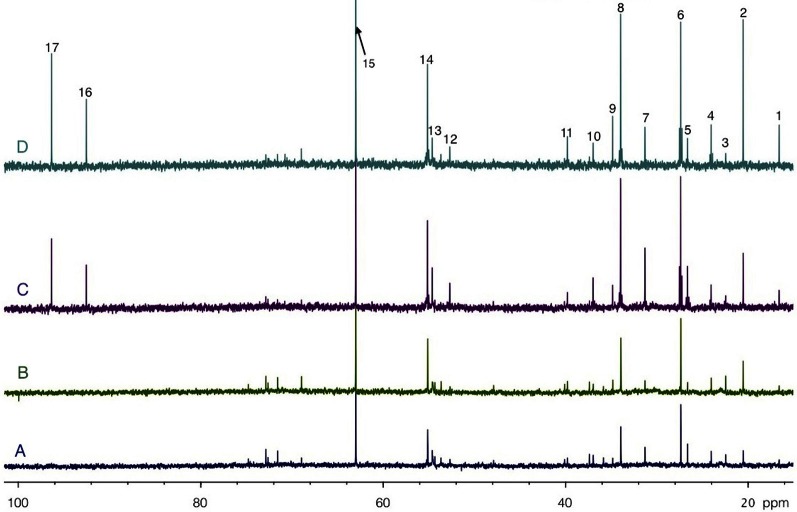
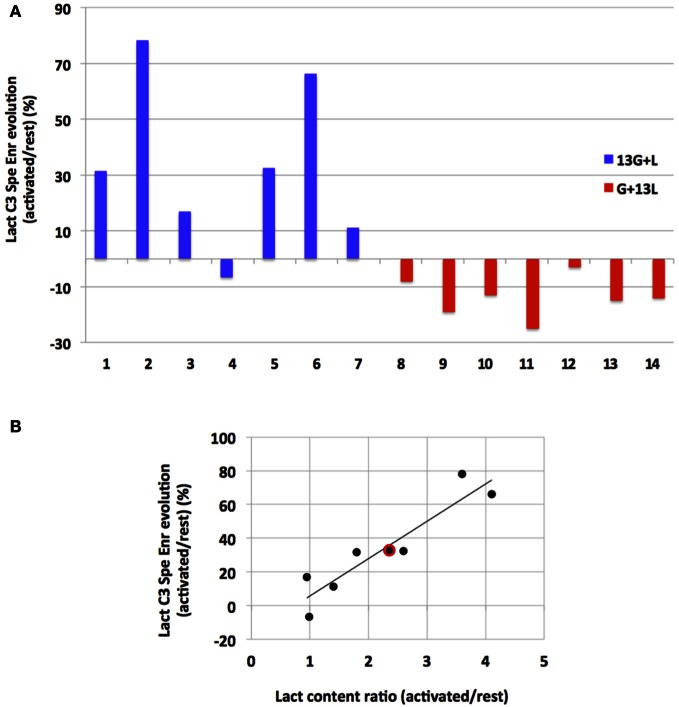
Glucose is the major energetic substrate for the brain but evidence has accumulated during the last 20 years that lactate produced by astrocytes could be an additional substrate for neurons. However, little information exists about this lactate shuttle in vivo in activated and awake animals. We designed an experiment in which the cortical barrel field (S1BF) was unilaterally activated during infusion of both glucose and lactate (alternatively labeled with (13)C) in rats. At the end of stimulation (1 h) both S1BF areas were removed and analyzed by HR-MAS NMR spectroscopy to compare glucose and lactate metabolism in the activated area vs. the non-activated one. In combination with microwave irradiation HR-MAS spectroscopy is a powerful technical approach to study brain lactate metabolism in vivo. Using in vivo (14)C-2-deoxyglucose and autoradiography we confirmed that whisker stimulation was effective since we observed a 40% increase in glucose uptake in the activated S1BF area compared to the ipsilateral one. We first determined that lactate observed on spectra of biopsies did not arise from post-mortem metabolism. (1)H-NMR data indicated that during brain activation there was an average 2.4-fold increase in lactate content in the activated area. When [1-(13)C]glucose + lactate were infused (13)C-NMR data showed an increase in (13)C-labeled lactate during brain activation as well as an increase in lactate C3-specific enrichment. This result demonstrates that the increase in lactate observed on (1)H-NMR spectra originates from newly synthesized lactate from the labeled precursor ([1-(13)C]glucose). It also shows that this additional lactate does not arise from an increase in blood lactate uptake since it would otherwise be unlabeled. These results are in favor of intracerebral lactate production during brain activation in vivo which could be a supplementary fuel for neurons.

Keywords: 13C NMR spectroscopy; astrocytes; brain metabolism; lactate; neurons.


Figures

Figure 1
Figure 1
Time evolution of labeled glucose and lactate during infusion. (A) Glucose (squares) and lactate (circles) concentrations (mM) were measured during infusion (glucose 750 mM and lactate 534 mM), both in anesthetized (blue) and awake (red) rats; n = 4. No statistical difference (except for glucose concentration, time point 5 min). (B) [1-13C]glucose (squares) and [3-13C]lactate (circles) specific enrichments (%) were measured during infusion with [1-13C]glucose + lactate (filled dots, n = 7) or glucose + [3-13C]lactate (open dots, n = 7), both in anesthetized (blue) and awake (red) rats. p < 0.05 between awake and anesthetized rats at the end of the infusion.
Figure 2
Figure 2
Functional activation of the brain during whisker stimulation. Digitized, pseudocolored autoradiogram of the distribution of 14C-2-deoxyglucose uptake on representative brain section from awake and unilaterally stimulated rat. The region of interest is represented by the white circle.
Figure 3
Figure 3
Determination of brain tissue lactate content as function of the sacrifice procedure. HRMAS 1H-NMR spectra of brain biopsies rapidly removed after euthanasia by (A) decapitation, (B) funnel freezing, and (C) focused microwaves. Lactate can be detected on the spectra (red arrows) at 1.32 ppm (doublet, protons linked to carbon 3) and at 4.11 ppm (quadruplet, proton linked to carbon 2). Spectra were normalized thanks to biopsie weights and fumarate peak (6.9 ppm), added as an external reference.
Figure 4
Figure 4
HRMAS 1H-NMR spectra of perchloric acid extracts of rest (A) and activated (B) S1BF areas. Spectra were obtained from rat n°5, in which ratio of lactate between rest (A) and activated (B) S1BF was 2.6, representing the closer the mean ratio in the 14 rats. The difference between the two spectra is presented in (C). Ethylen glycol was added as an internal reference. Lact, lactate; NAA, N-acetyl-aspartate; Glu, glutamate; Gln, glutamine; Asp, aspartate.
Figure 5
Figure 5
HRMAS 13C-NMR spectra of perchloric acid extracts of rest (A and C) and activated (B and D) S1BF areas, after infusion with glucose + [3-13C]lactate (A and B) or [1-13C]glucose + lactate (C and D). Spectra were normalized owing to their protein contents and to the EG peak (15, 63 ppm). Peak assignments: 1: alanine C3, 2: lactate C3, 3: NAA C6, 4: GABA C3, 5: glutamine C3, 6: glutamate C3, 7: glutamine C4, 8: glutamate C4, 9: GABA C2, 10: aspartate C3, 11: GABA C4, 12: aspartate C2, 13: glutamine C2, 14: glutamate C2, 15: EG, 16: glucose C1α, 17: glucose C1β.
Figure 6
Figure 6
Evolution of lactate C3 specific enrichment for each rat (A) and correlation between its evolution and lactate content during activation (B). (A) Evolutions of lactate C3 specific enrichment (activated over rest, %) are presented for each independent experiment after infusion with [1-13C]glucose+lactate (n=7, rat 1 to rat 7, blue) or with glucose + [3-13C]lactate (n=7, rat 8–14, red). (B) Linear regression between lactate concentration increase (ratio between lactate content measured in the activated S1BF and the one measured in the rest S1BF on 1H-NMR spectra) and lactate C3 specific enrichment increases (values in A, blue) for the [1-13C]glucose + lactate condition (rat 1–7). Red dot represents the mean values in this latter condition (a 2.4-fold increase in the lactate content, and a 33% increase in lactate C3 specific enrichments). r2= 0.86.

References

    1. Abi-Saab W. M., Maggs D. G., Jones T., Jacob R., Srihari V., Thompson J., et al. (2002). Striking differences in glucose and lactate levels between brain extracellular fluid and plasma in conscious human subjects: effects of hyperglycemia and hypoglycemia. J. Cereb. Blood Flow Metab. 22, 271–279 10.1097/00004647-200203000-00004 - DOI - PubMed
    1. Bak L. K., Schousboe A., Sonnewald U., Waagepetersen H. S. (2006). Glucose is necessary to maintain neurotransmitter homeostasis during synaptic activity in cultured glutamatergic neurons. J. Cereb. Blood Flow Metab. 26, 1285–1297 10.1038/sj.jcbfm.9600281 - DOI - PubMed
    1. Bakken I. J., White L. R., Aasly J., Unsgard G., Sonnewald U. (1998). [U-13C] aspartate metabolism in cultured cortical astrocytes and cerebellar granule neurons studied by NMR spectroscopy. Glia 23, 271–277 10.1002/(SICI)1098-1136(199807)23:3<271::AID-GLIA9>3.0.CO;2-7 - DOI - PubMed
    1. Bergersen L. H., Gjedde A. (2012). Is lactate a volume transmitter of metabolic states of the brain? Front. Neuroenergetics 4:5 10.3389/fnene.2012.00005 - DOI - PMC - PubMed
    1. Bonvento G., Herard A. S., Voutsinos-Porche B. (2005). The astrocyte–neuron lactate shuttle: a debated but still valuable hypothesis for brain imaging. J. Cereb. Blood Flow Metab. 25, 1394–1399 10.1038/sj.jcbfm.9600127 - DOI - PubMed

LinkOut - more resources