

Prime-boost strategies in mucosal immunization affect local IgA production and the type of th response
- PMID: 23755051
- PMCID: PMC3665932
- DOI: 10.3389/fimmu.2013.00128
Prime-boost strategies in mucosal immunization affect local IgA production and the type of th response
Abstract
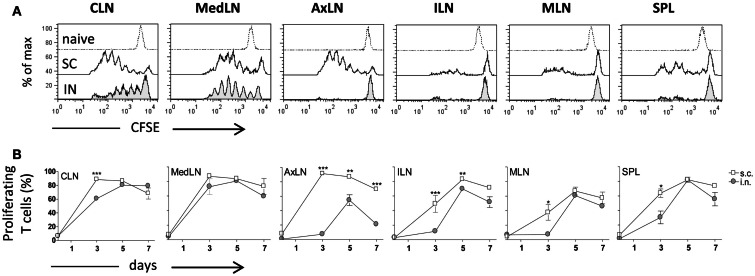
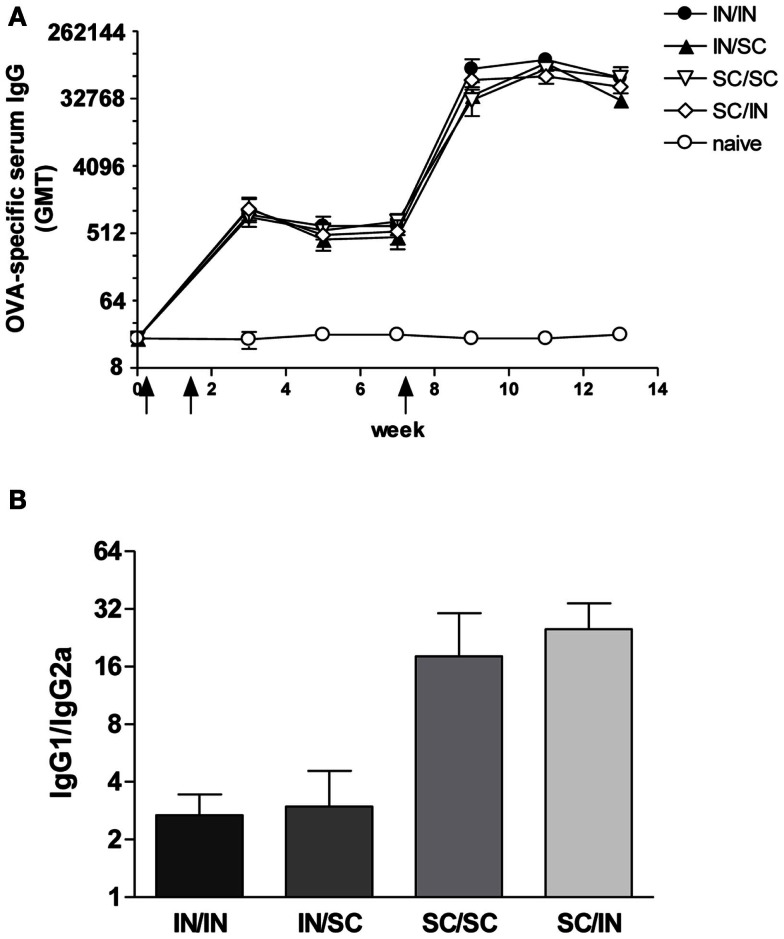
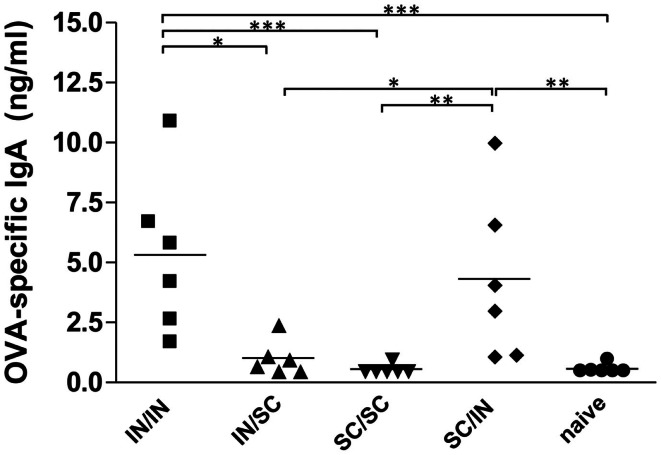
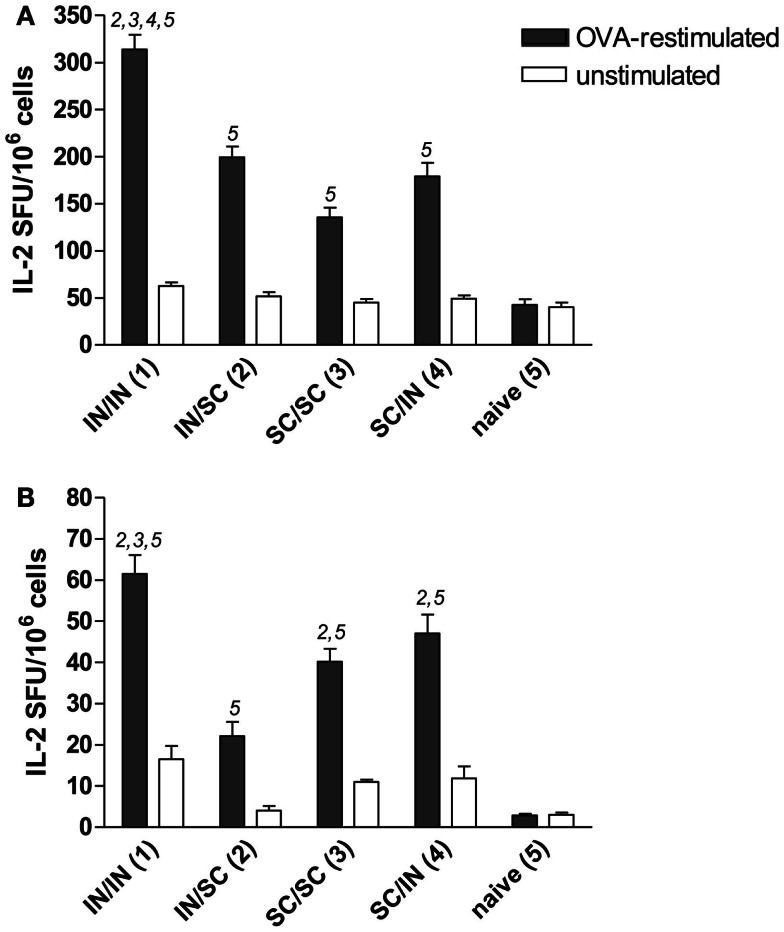
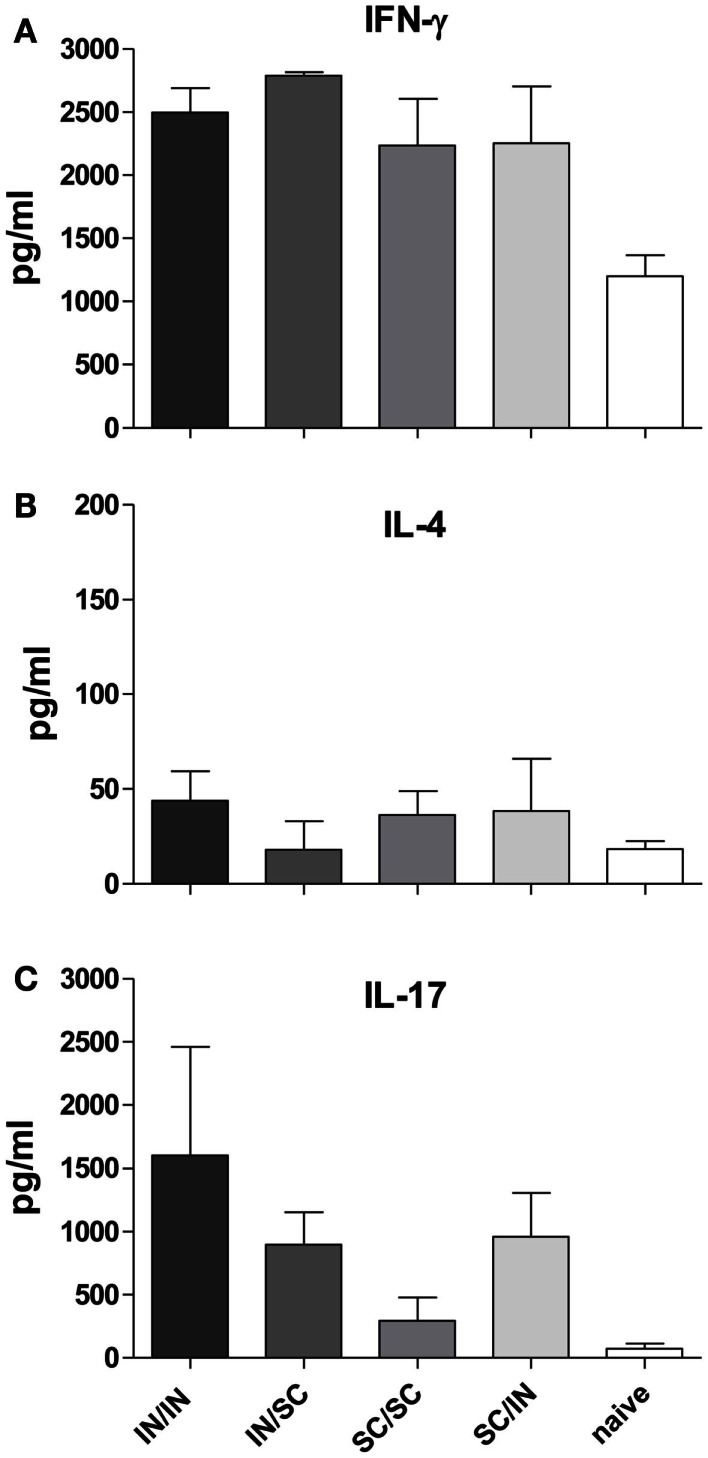
Combinations of different delivery routes for priming and boosting represent vaccination strategies that can modulate magnitude, quality, and localization of the immune response. A murine model was used to study T cell clonal expansion following intranasal (IN) or subcutaneous (SC) priming, and secondary immune responses after boosting by either homologous or heterologous routes. T cell primary activation was studied by using the adoptive transfer model of ovalbumin-specific transgenic CD4(+) T cells. Both IN and SC immunization efficiently elicited, in the respective draining lymph nodes, primary clonal expansion of antigen-specific CD4(+) T cells that disseminated toward distal lymph nodes (mesenteric and iliac) and the spleen. After boosting, a significant serum IgG response was induced in all groups independent of the combination of immunization routes used, while significant levels of local IgA were detected only in mice boosted by the IN route. Mucosal priming drove a stronger Th1 polarization than the systemic route, as shown by serum IgG subclass analysis. IFN-gamma production was observed in splenocytes of all groups, while prime-boost vaccine combinations that included the mucosal route, yielded higher levels of IL-17. Memory lymphocytes were identified in both spleen and draining lymph nodes in all immunized mice, with the highest number of IL-2 producing cells detected in mice primed and boosted by the nasal route. This work shows the critical role of immunization routes in modulating quality and localization of immune responses in prime-boost vaccine strategies.
Keywords: T cell priming; cytokines; mucosal immune response; nasal immunization; prime-boost; subcutaneous immunization.
Figures
Similar articles
-
Characterization of the Antigen-Specific CD4(+) T Cell Response Induced by Prime-Boost Strategies with CAF01 and CpG Adjuvants Administered by the Intranasal and Subcutaneous Routes.Front Immunol. 2015 Aug 28;6:430. doi: 10.3389/fimmu.2015.00430. eCollection 2015. Front Immunol. 2015. PMID: 26379666 Free PMC article.
-
Prime-boost immunization schedules based on influenza virus and vaccinia virus vectors potentiate cellular immune responses against human immunodeficiency virus Env protein systemically and in the genitorectal draining lymph nodes.J Virol. 2003 Jun;77(12):7048-57. doi: 10.1128/jvi.77.12.7048-7057.2003. J Virol. 2003. PMID: 12768024 Free PMC article.
-
More robust gut immune responses induced by combining intranasal and sublingual routes for prime-boost immunization.Hum Vaccin Immunother. 2018;14(9):2194-2202. doi: 10.1080/21645515.2018.1472185. Epub 2018 Jun 19. Hum Vaccin Immunother. 2018. PMID: 29781755 Free PMC article.
-
Current status and potential application of ISCOMs in veterinary medicine.Adv Drug Deliv Rev. 2004 Jun 23;56(10):1367-82. doi: 10.1016/j.addr.2004.02.004. Adv Drug Deliv Rev. 2004. PMID: 15191787 Review.
-
CD4(+) T Cell Priming as Biomarker to Study Immune Response to Preventive Vaccines.Front Immunol. 2013 Dec 4;4:421. doi: 10.3389/fimmu.2013.00421. Front Immunol. 2013. PMID: 24363656 Free PMC article. Review.
Cited by
-
Generation of a single-cell B cell atlas of antibody repertoires and transcriptomes to identify signatures associated with antigen specificity.iScience. 2023 Jan 25;26(3):106055. doi: 10.1016/j.isci.2023.106055. eCollection 2023 Mar 17. iScience. 2023. PMID: 36852274 Free PMC article.
-
Effects of prime-boost strategies on the protective efficacy and immunogenicity of a PLGA (85:15)-encapsulated Chlamydia recombinant MOMP nanovaccine.Pathog Dis. 2024 Feb 7;82:ftae004. doi: 10.1093/femspd/ftae004. Pathog Dis. 2024. PMID: 38862192 Free PMC article.
-
SARS-CoV-2 mRNA vaccination induces an intranasal mucosal response characterized by neutralizing antibodies.J Allergy Clin Immunol Glob. 2023 Jun 25;2(4):100129. doi: 10.1016/j.jacig.2023.100129. eCollection 2023 Nov. J Allergy Clin Immunol Glob. 2023. PMID: 37781659 Free PMC article.
-
A Nasal Vaccine Displaying Anthrax Antigen on the Surface of Lactiplantibacillus plantarum Induces Protective Mucosal Immunity against Anthrax Toxin.J Microbiol Biotechnol. 2025 May 26;35:e2503036. doi: 10.4014/jmb.2503.03036. J Microbiol Biotechnol. 2025. PMID: 40443240 Free PMC article.
-
An intranasal vaccine targeting the receptor binding domain of SARS-CoV-2 elicits a protective immune response.Front Immunol. 2022 Nov 16;13:1005321. doi: 10.3389/fimmu.2022.1005321. eCollection 2022. Front Immunol. 2022. PMID: 36466882 Free PMC article.
References
LinkOut - more resources
Full Text Sources
Other Literature Sources
Research Materials
Miscellaneous