. 2013 May 31:4:97.
doi: 10.3389/fgene.2013.00097. eCollection 2013.

Heterogeneity of expression of epithelial-mesenchymal transition markers in melanocytes and melanoma cell lines

Affiliations

Heterogeneity of expression of epithelial-mesenchymal transition markers in melanocytes and melanoma cell lines

Ji Eun Kim et al. Front Genet. .

Abstract

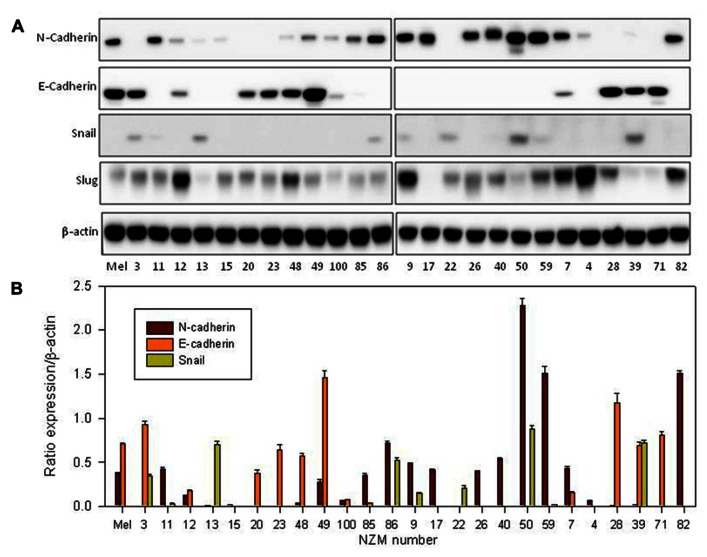
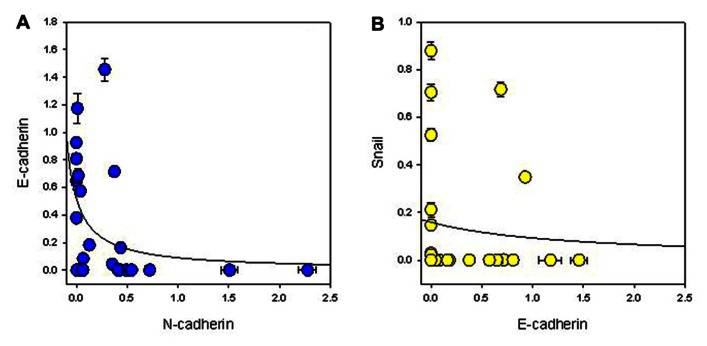
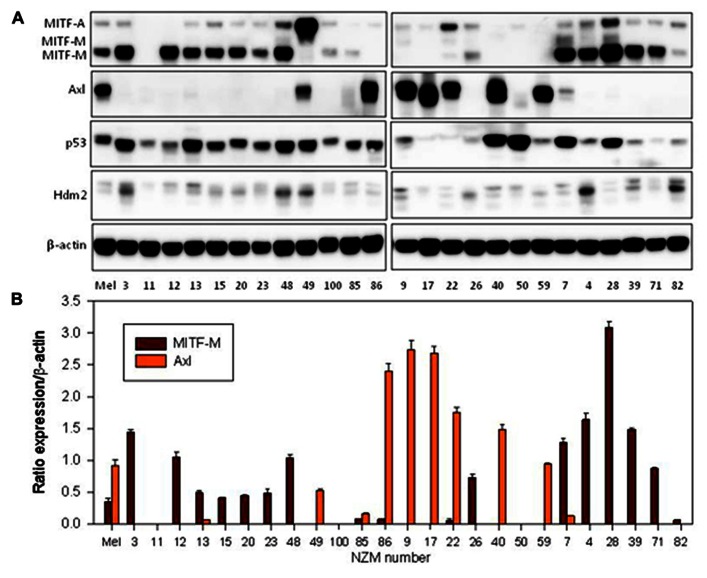
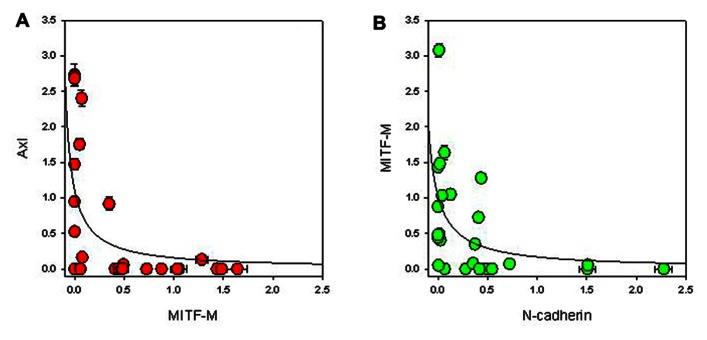
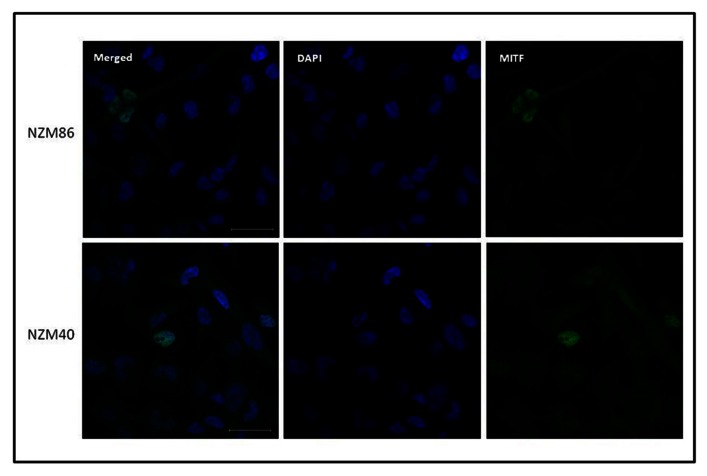
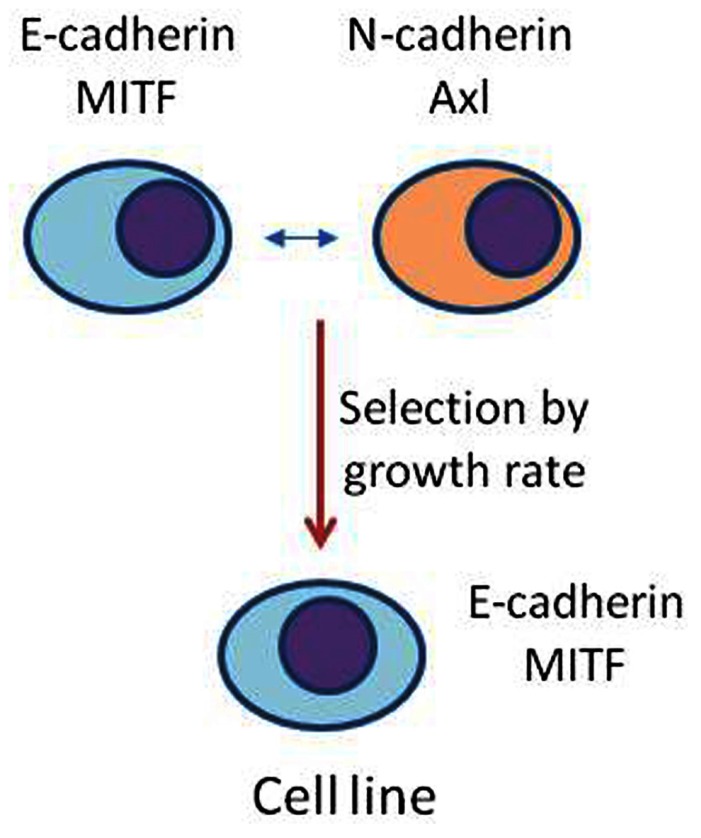
The epithelial-mesenchymal transition (EMT) describes a reversible switch from an epithelial-like to a mesenchymal-like phenotype. It is essential for the development of the normal epithelium and also contributes to the invasive properties of carcinomas. At the molecular level, the EMT transition is characterized by a series of coordinated changes including downregulation of the junctional protein E-cadherin (CDH1), up-regulation of transcriptional repressors of E-cadherin such as Snail (SNAI1) and Slug (SNAI2), and up-regulation of N-cadherin. We wished to determine whether cultured normal melanocytes and melanoma cell lines, which are derived from the neural crest, showed signs of a similarly coordinated phenotypic switch. We investigated normal melanocytes and 25 cell lines derived from New Zealand patients with metastatic melanoma. Most lines had been previously genotyped for common mutations such as BRAF, NRAS, PIK3CA (phosphatidylinositol-3-kinase), TP53 (p53), and CDKN2A (p16). Expression of E-cadherin, N-cadherin, microphthalmia-associated transcription factor (MITF), Snail, Slug, Axl, p53, and Hdm2 was compared by western blotting. Normal melanocytes expressed each of these proteins except for Snail, while normal melanocytes and almost every melanoma line expressed Slug. Expression of individual markers among different melanoma lines varied from high to low or undetectable. Quantitation of western blots showed that expression of MITF-M, the melanocyte-specific isoform of MITF, was positively related to that of E-cadherin but inversely related to that of N-cadherin and Axl. There was also no apparent relationship between expression of any particular marker and the presence of BRAF, NRAS, PIK3CA, TP53, or CDKN2A mutations. The results suggest that melanomas do not show the classical epithelial and mesenchymal phenotypes but rather display either high E-cadherin/high MITF-M expression on one hand, or high N-cadherin/high Axl expression on the other. These may correspond to differentiated and invasive phenotypes in vivo.

Keywords: Axl; E-cadherin; MITF; melanocyte; melanoma.


Figures

FIGURE 1
FIGURE 1
(A) Western blots of whole-cell extracts derived from cultures of normal melanocytes and of a number of melanoma lines, indicating expression of N-cadherin, E-cadherin, Snail, and Slug. The numbers indicate the identities of members of the New Zealand melanoma collection (e.g., 3 = NZM3); Mel indicates data for normal melanocytes. The western blot shown is representative of three independent repeats. (B) Western blot quantification of E-cadherin, N-cadherin, and Snail as ratios to β-actin loading controls. Bars show SEM.
FIGURE 2
FIGURE 2
Relationship between expression of (A) N-cadherin and E-cadherin, and (B) E-cadherin and Snail normalized to β-actin expression. The lines indicate best-fit hyperbolae.
FIGURE 3
FIGURE 3
(A) Western blots of extracts from cultures of normal melanocytes and of a number melanoma lines, indicating expression of MITF-M (bottom two bands), MITF-A (top band), Axl, p53, and Hdm2. The numbers indicate the identities of members of the New Zealand melanoma collection; Mel indicates data for normal melanocytes. The western blot shown is representative of three independent repeats. (B) Western blot quantification of MITF-M and Axl as ratios to β-actin loading controls. Bars show SEM.
FIGURE 4
FIGURE 4
Relationship between expression of (A) MITF-M and Axl, and (B) MITF-M and N-cadherin normalized to β-actin expression. The lines indicate best-fit hyperbolae.
FIGURE 5
FIGURE 5
Immunofluorescent images of NZM40 and NZM86 stained for MITF (green) and for DNA (diaminophenylindole: blue). Scale bars on the merged image indicate 50 μm.
FIGURE 6
FIGURE 6
Possible model for the generation of melanoma cell lines. Phenotypic switching in vivo generates a highly heterogeneous population of cells that vary in expression of proteins such as E-cadherin, N-cadherin, Axl, and M-MITF. Derivation of a cell line, by selecting for rapid proliferation, may select for an individual phenotype.

References

    1. Araki S., Eitel J. A., Batuello C. N., Bijangi-Vishehsaraei K., Xie X. J., Danielpour D., et al. (2010). TGF-beta1-induced expression of human Mdm2 correlates with late-stage metastatic breast cancer. J. Clin. Invest. 120 290–302 10.1172/JCI39194 - DOI - PMC - PubMed
    1. Baguley B. C. (2011). The paradox of cancer cell apoptosis. Front. Biosci. 16 1759–1767 10.2741/3819 - DOI - PubMed
    1. Carreira S., Goodall J., Denat L., Rodriguez M., Nuciforo P., Hoek K. S., et al. (2006). Mitf regulation of Dia1 controls melanoma proliferation and invasiveness. Genes Dev. 20 3426–3439 10.1101/gad.406406 - DOI - PMC - PubMed
    1. Charters G. A., Stones C. J., Shelling A. N., Baguley B. C., Finlay G. J. (2011). Centrosomal dysregulation in human metastatic melanoma cell lines. Cancer Genet. 204 477–485 10.1016/j.cancergen.2011.07.001 - DOI - PubMed
    1. Cheli Y., Giuliano S., Botton T., Rocchi S., Hofman V., Hofman P., et al. (2011). Mitf is the key molecular switch between mouse or human melanoma initiating cells and their differentiated progeny. Oncogene 30 2307–2318 10.1038/onc.2010.598 - DOI - PubMed