

Mortality attributable to seasonal and pandemic influenza, Australia, 2003 to 2009, using a novel time series smoothing approach
- PMID: 23755139
- PMCID: PMC3670851
- DOI: 10.1371/journal.pone.0064734
Mortality attributable to seasonal and pandemic influenza, Australia, 2003 to 2009, using a novel time series smoothing approach
Abstract
Background: Official statistics under-estimate influenza deaths. Time series methods allow the estimation of influenza-attributable mortality. The methods often model background, non-influenza mortality using a cyclic, harmonic regression model based on the Serfling approach. This approach assumes that the seasonal pattern of non-influenza mortality is the same each year, which may not always be accurate.
Aim: To estimate Australian seasonal and pandemic influenza-attributable mortality from 2003 to 2009, and to assess a more flexible influenza mortality estimation approach.
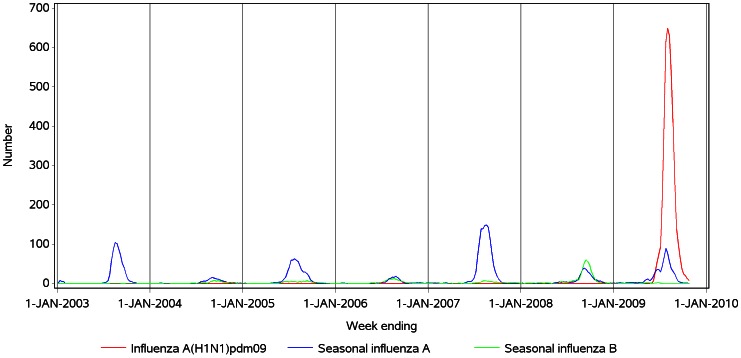
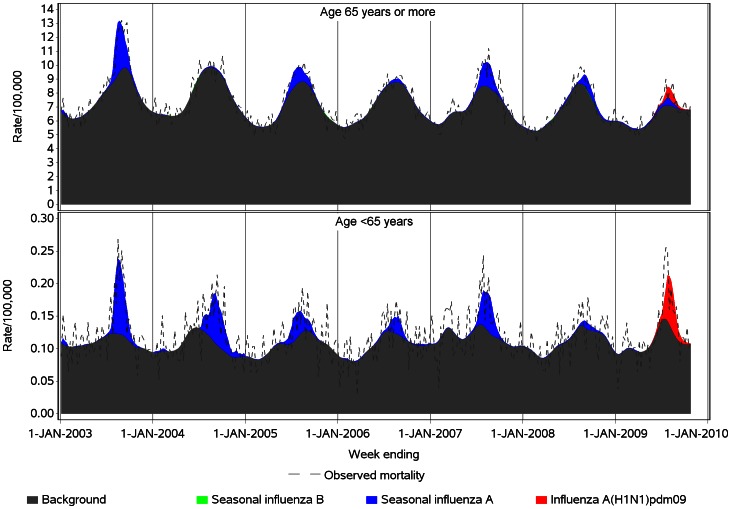
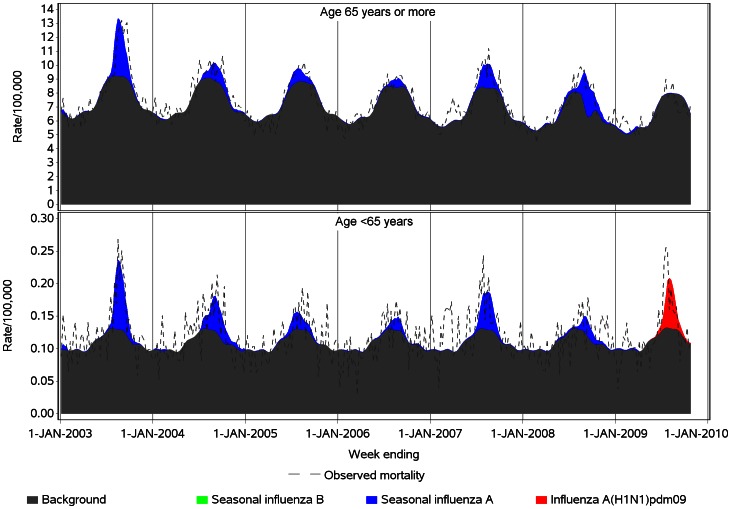
Methods: We used a semi-parametric generalized additive model (GAM) to replace the conventional seasonal harmonic terms with a smoothing spline of time ('spline model') to estimate influenza-attributable respiratory, respiratory and circulatory, and all-cause mortality in persons aged <65 and ≥ 65 years. Influenza A(H1N1)pdm09, seasonal influenza A and B virus laboratory detection time series were used as independent variables. Model fit and estimates were compared with those of a harmonic model.
Results: Compared with the harmonic model, the spline model improved model fit by up to 20%. In <65 year-olds, the estimated respiratory mortality attributable to pandemic influenza A(H1N1)pdm09 was 0.5 (95% confidence interval (CI), 0.3, 0.7) per 100,000; similar to that of the years with the highest seasonal influenza A mortality, 2003 and 2007 (A/H3N2 years). In ≥ 65 year-olds, the highest annual seasonal influenza A mortality estimate was 25.8 (95% CI 22.2, 29.5) per 100,000 in 2003, five-fold higher than the non-statistically significant 2009 pandemic influenza estimate in that age group. Seasonal influenza B mortality estimates were negligible.
Conclusions: The spline model achieved a better model fit. The study provides additional evidence that seasonal influenza, particularly A/H3N2, remains an important cause of mortality in Australia and that the epidemic of pandemic influenza A (H1N1)pdm09 virus in 2009 did not result in mortality greater than seasonal A/H3N2 influenza mortality, even in younger age groups.
Conflict of interest statement
Figures
References
-
- Farr W (1885) Influenza epidemic, 1847. In: Humphries N, editor. Vital statistics. London: Office of the Sanitary Institute. 330–333.
-
- Collins SD, Frost WH, Gover M, Sydenstricker E (1930) Mortality from Influenza and Pneumonia in 50 Large Cities of the United States, 1910–1929. Public Health Reports (1896–1970) 45: 2277–2328.
-
- Australian Bureau of Statistics (2009) Causes of Death, Australia 2007. Catalogue no. 3303.0. Canberra: Australian Bureau of Statistics.
-
- Newall AT, Viboud C, Wood JG (2010) Influenza-attributable mortality in Australians aged more than 50 years: a comparison of different modelling approaches. Epidemiol Infect 138: 836–842. - PubMed
Publication types
MeSH terms
LinkOut - more resources
Full Text Sources
Other Literature Sources
