

Association between cannabinoid CB₁ receptor expression and Akt signalling in prostate cancer
- PMID: 23755281
- PMCID: PMC3673925
- DOI: 10.1371/journal.pone.0065798
Association between cannabinoid CB₁ receptor expression and Akt signalling in prostate cancer
Abstract
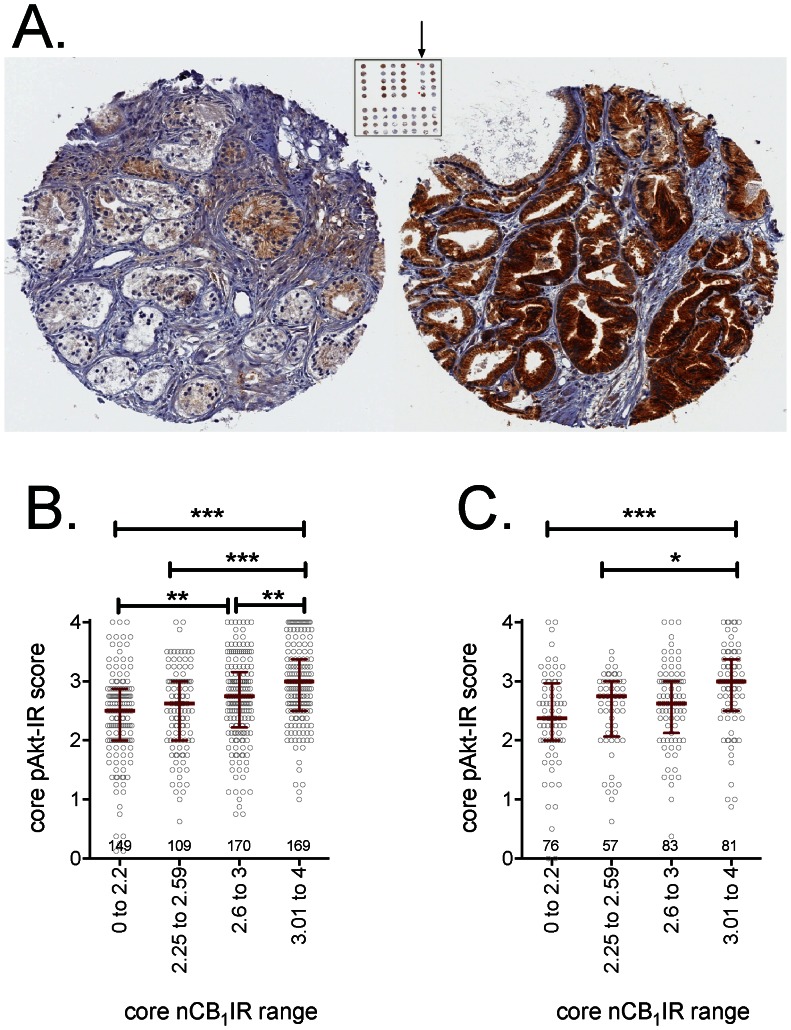
Background: In prostate cancer, tumour expression of cannabinoid CB₁ receptors is associated with a poor prognosis. One explanation for this association comes from experiments with transfected astrocytoma cells, where a high CB receptor expression recruits the Akt signalling survival pathway. In the present study, we have investigated the association between CB₁ receptor expression and the Akt pathway in a well-characterised prostate cancer tissue microarray.
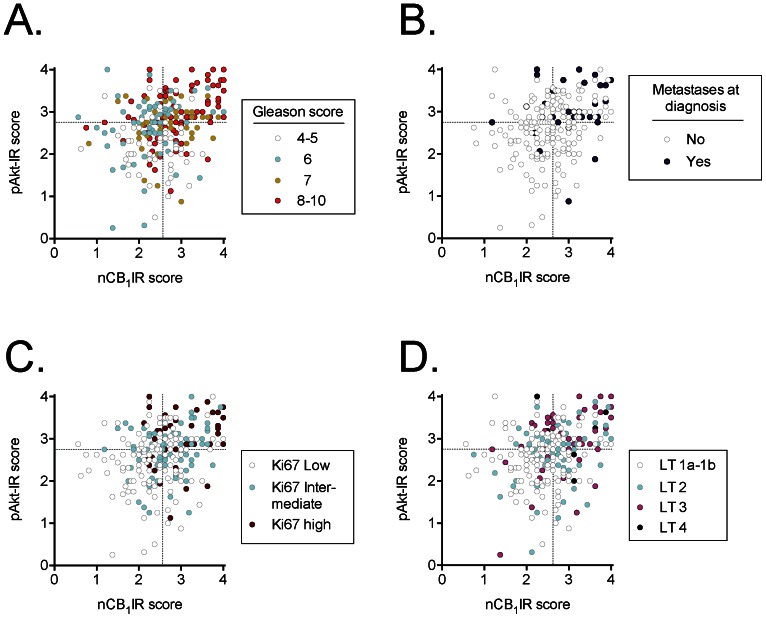
Methodology/principal findings: Phosphorylated Akt immunoreactivity (pAkt-IR) scores were available in the database. CB₁ receptor immunoreactivity (CB₁IR) was rescored from previously published data using the same scale as pAkt-IR. There was a highly significant correlation between CB₁IR and pAkt-IR. Further, cases with high expression levels of both biomarkers were much more likely to have a more severe form of the disease at diagnosis than those with low expression levels. The two biomarkers had additive effects, rather than an interaction, upon disease-specific survival.
Conclusions/significance: The present study provides data that is consistent with the hypothesis that at a high CB₁ receptor expression, the Akt signalling pathway becomes operative.
Conflict of interest statement
Figures
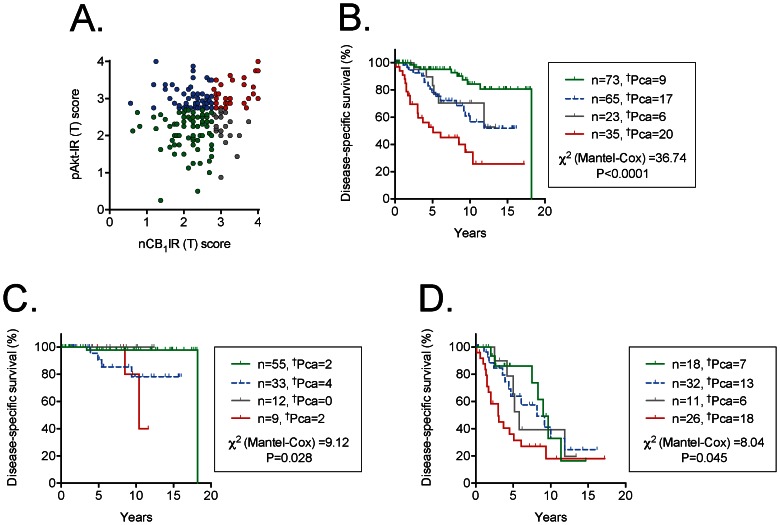
 2 values are for the log-rank (Mantel-Cox) tests, with the P values shown. Panel B, all cases; Panel C, Gleason score 4–6 cases; Panel D, Gleason score 7–10 cases.
References
-
- Freimuth N, Ramer R, Hinz B (2010) Antitumorigenic effects of cannabinoids beyond apoptosis. J Pharmacol Exp Ther 332: 336–344. - PubMed
-
- Fowler CJ, Gustafsson SB, Chung SC, Persson E, Jacobsson SOP, et al. (2010) Targeting the endocannabinoid system for the treatment of cancer - a practical view. Curr Top Med Chem 10: 814–827. - PubMed
-
- Díaz-Laviada I (2011) The endocannabinoid system in prostate cancer. Nat Rev Urol 8: 553–561. - PubMed
-
- Velasco G, Sanchez C, Guzmán M (2012) Towards the use of cannabinoids as antitumour agents. Nat Rev Cancer 12: 436–444. - PubMed
Publication types
MeSH terms
Substances
LinkOut - more resources
Full Text Sources
Other Literature Sources
Medical
Research Materials
Miscellaneous
