. 2013:4:1988.
doi: 10.1038/ncomms2988.

Quasi-monoenergetic laser-plasma acceleration of electrons to 2 GeV

Affiliations
Free PMC article

Quasi-monoenergetic laser-plasma acceleration of electrons to 2 GeV

Xiaoming Wang et al. Nat Commun. 2013.
Free PMC article

Abstract

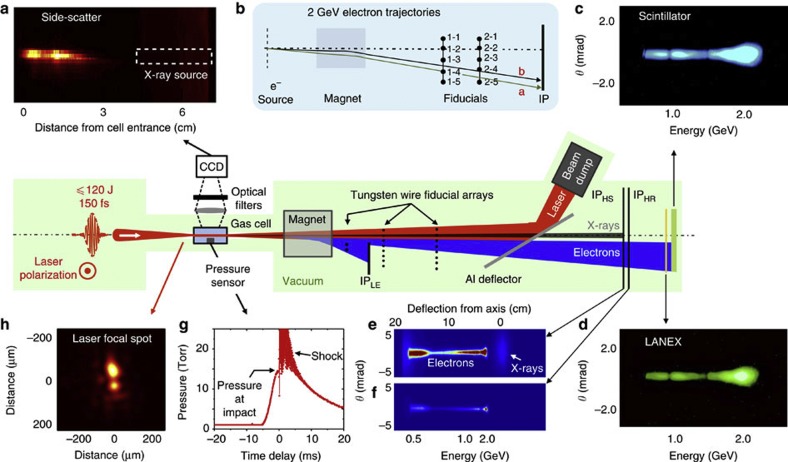
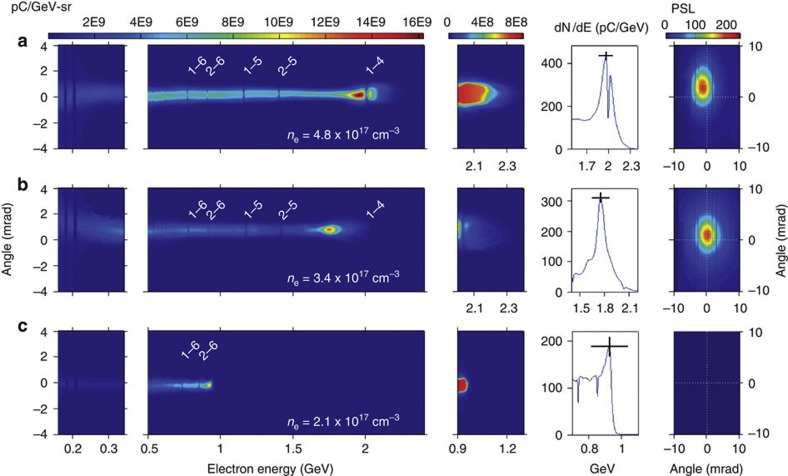
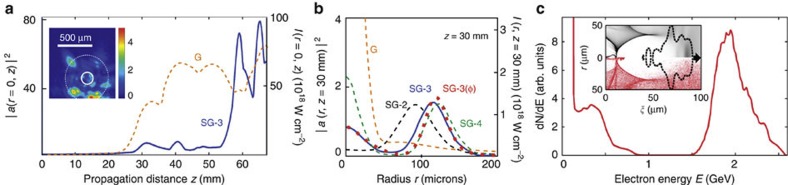
Laser-plasma accelerators of only a centimetre's length have produced nearly monoenergetic electron bunches with energy as high as 1 GeV. Scaling these compact accelerators to multi-gigaelectronvolt energy would open the prospect of building X-ray free-electron lasers and linear colliders hundreds of times smaller than conventional facilities, but the 1 GeV barrier has so far proven insurmountable. Here, by applying new petawatt laser technology, we produce electron bunches with a spectrum prominently peaked at 2 GeV with only a few per cent energy spread and unprecedented sub-milliradian divergence. Petawatt pulses inject ambient plasma electrons into the laser-driven accelerator at much lower density than was previously possible, thereby overcoming the principal physical barriers to multi-gigaelectronvolt acceleration: dephasing between laser-driven wake and accelerating electrons and laser pulse erosion. Simulations indicate that with improvements in the laser-pulse focus quality, acceleration to nearly 10 GeV should be possible with the available pulse energy.


Figures

Figure 1
Figure 1. Schematic diagram of PW laser-driven wakefield accelerator.
The main components were enclosed in a vacuum chamber, highlighted in green, which was kept at 10−6 Torr. The PW laser pulse, entering from the left and linearly polarized perpendicular to the plane of the drawing, was focused into the gas cell, where it created a He plasma and wake that captured and accelerated electrons to 2 GeV. Electrons and betatron X-rays emerging from the cell exit aperture passed through a magnetic field, then through two linear arrays of eight 127 μm diameter tungsten-wire fiducials located 1.256 and 1.764 m, respectively, downstream from the cell exit. A 25-μm thick Al foil deflected the transmitted laser pulse to a beam dump. Undeflected X-rays and energy-dispersed electrons above 0.5 GeV passed through this foil, and exposed in sequence a high-sensitivity (HS) imaging plate (IPHS), a high-resolution (HR) IP (IPHR), a phosphorescing screen (LANEX) and a plastic scintillator. An additional IPLE recorded low-energy (LE) electrons (<0.35 GeV) after they passed through a third array of fiducials. Surrounding panels highlight various diagnostics and details, clockwise from upper left: (a) transversely scattered light, spectrally filtered and imaged to a CCD camera (the dashed rectangle shows the region near the cell exit from which betatron X-rays originated, as determined by X-ray triangulation); (b) trajectories of 2 GeV electrons for shots that yielded the results in Fig. 2a (labelled ‘a’ and ‘b’, respectively) relative to the fiducial arrays (labelled 1–1 through to 1–8 for the first array and 2–1 through to 2–8 for the second array); (cf), unprocessed data showing electrons up to 2.3 GeV and fiducial shadows for the shot that yielded the results in Fig. 2a, as detected on (c) scintillator, (d) LANEX, (e) IPHS (also showing undeflected X-rays) and (f) IPHR; (g) He pressure versus time, and an acoustic shock when the laser pulse arrived, as recorded by a fast pressure transducer; (h) a typical laser focal spot.
Figure 2
Figure 2. Electron spectra and betatron X-ray profiles for three shots from the accelerator.
First column: sub-GeV electron spectra recorded on IPLE; second column: GeV electron spectra recorded on IPHS; third column: detail of high-energy tails; fourth column: vertically integrated spectra around each high-energy peak; fifth column: betatron X-ray angular distribution recorded on IPHS. (a) Results for shot yielding quasi-monoenergetic peak at 2.0 GeV, with ne=4.8 × 1017 cm−3, obtained from raw data shown in Fig. 1e. Results for (b) ne=3.4 × 1017 cm−3, yielding peak at 1.8 GeV, and (c) ne=2.1 × 1017 cm−3, yielding peak at 0.95 GeV. Table 1 lists complete laser-plasma conditions and e-beam properties for each shot. Fiducial wire shadows are labelled as in Fig. 1b. On each vertical scale, ‘0 mrad’ denotes the average vertical position of a 30-shot sequence of GeV electrons. In the fourth column, vertical error bars represent the average uncertainty in the calibration of each of IPHS, high-resolution IP (IPHR) and LANEX as charge monitors (±10%); horizontal error bars represent 2σ uncertainty in the peak position, derived from the uncertainty in fitting the calculated trajectories of electrons near 2 GeV to the observed positions of fiducial shadows on IPHS for each shot. This uncertainty originates in turn from the combined uncertainty in fiducial wire positions (±25 μm transversely, ±2 mm longitudinally), fiducial shadow positions (±1/2 pixel, or ±50 μm), electron source position (determined by X-ray triangulation) relative to magnet and detector (±75 μm transversely, ±1 cm longitudinally) and magnetic field (±1%).
Figure 3
Figure 3. Betatron X-ray data.
(a) Typical radiograph of Al and Cu masks backlit by betatron X-rays from the accelerator recorded on IPHS. Masks vary in thickness in four lateral steps: 2 mm (centre), 1 mm, 0.5 mm and 0.25 mm (edge). Vertical lines are shadows of tungsten-wire fiducials. (b) Typical X-ray spectrum. Data points were obtained by analysing transmittance of the Cu/Al masks (see Methods). Horizontal error bars correspond to the FWHM of the fk distribution (see Methods); vertical error bars represent uncertainty in X-ray transmission caused by scattering at edges of the filter masks, and error in reconstructing the incident X-ray intensity profile from transmission through gaps in the masks. Blue curve is a cubic spline fit to the data points. (c) X-ray source locations within the 7 cm gas cell for 22 shots that yielded >1 GeV electrons, determined by triangulation from tungsten-wire fiducial shadows. Source locations for shots in Fig. 2a are labelled ‘a’ (red) and ‘b’ (yellow), respectively. Horizontal error bars (±10 mm) indicate triangulation error arising from uncertainty in measuring fiducial wire positions.
Figure 4
Figure 4. WAKE simulation results.
Initial conditions are: pre-ionized plasma of density ne=5.0 × 1017 cm−3; incident laser pulse of duration τ=160 fs, energy=100 J (peak laser strength parameter a0=0.58, normalized power P/Pcr=20). (a) Laser strength parameter a(r=0,z) and peak intensity I(r=0,z) along propagation axis inside plasma for initially Gaussian (G, dashed orange curve) and third-order super-Gaussian (SG-3, solid blue) pulses of radius w0=275 μm, the latter showing two rapid self-focus/defocus cycles near the cell exit. Inset: image of incident laser profile at approximately the cell entrance, ~2 cm from its focal plane, for shot ‘a’ in Fig. 2, compared with white dashed circle of radius w0=275 μm and white solid circle of radius w0=80 μm. Colour scale indicates intensity as a multiple of 1017 W cm−2. (b) Transverse profiles at z=30 mm of initially Gaussian (G, short-dashed orange), second- (SG-2, short-dashed black), third- (SG-3, solid blue) and fourth- (SG-4, long-dashed green) order super-Gaussian pulses, showing Airy-ring-like structure for non-Gaussian profiles that is evidently critical for self injection. Each profile is plotted for the longitudinal position of maximum ∫0drrI(r) within the pump profile; this position differs slightly for each plot, and from the position of maximum peak intensity shown in a. For comparison, curve SG-3(φ) (red squares) shows the transverse profile at z=30 mm, calculated with the NLSE, of an initially third-order super-Gaussian multiplied by the azimuthally varying function 1+0.25(r/w0)9 cos (9φ) to mimic an evolving array of hotspots. (c) Simulated electron energy spectrum at z=6.8 cm for initially third-order super-Gaussian pulse evolving as in a, showing 2 GeV peak and low-energy tail. Similar spectra were obtained for other super-Gaussian orders and for ±10% variations in a0. Inset: electron density profile, showing background plasma electrons (black, top) and test electrons (red, bottom). Injected electrons are the red feature inside evacuated bubble. ξ denotes longitudinal distance along the bubble’s axis. Black dashed curve: 8 × 10¹⁸ W cm−2 iso-intensity contour of laser pulse at z=6.8 cm.
Figure 5
Figure 5. NLSE simulation illustrating topological changes of a relativistically self-focusing laser pulse.
The colour bars indicate the squared laser strength parameter a2. The laser pulse evolves according to the NLSE in a plasma of density ne=5 × 1017 cm−3. (a) Initial pulse at z=0 with azimuthally modulated super-Gaussian profile. Algebraic form and parameters are given in Methods. (b,c) The azimuthal perturbations quickly evolve into distinct hotspots by z=2 cm, similar to those present in the actual laser pulse. (d,e) Hotspots then evolve into a nearly cylindrically symmetric ring by z=3 cm, as the central peak intensifies. At this point, the radial profile is very similar to that of initially cylindrically symmetric super-Gaussian pulses, as shown in Fig. 4b. (f) By z=3.5 cm, the central peak becomes more intense than the outer ring. WAKE simulations of similar profiles suggest that this central peak continues intensifying rapidly, eventually forming a rapidly evolving bubble into which surrounding plasma electrons inject. At z=3.5 cm, however, the density perturbation has already become substantial, invalidating further description by the NLSE.

References

    1. Wilson E. An Introduction to Particle Accelerators Oxford University Press (2001).
    1. Chatrchyan S. et al. Observation of a new boson at a mass of 125 GeV with the CMS experiment at the LHC. Phys. Lett. B 716, 30–61 (2012).
    1. Tajima T. & Dawson J. S. Laser-electron accelerator. Phys. Rev. Lett. 43, 267–270 (1979).
    1. Esarey E. Schroeder C. B. & Leemans W. P. Physics of laser-driven plasma-based electron accelerators. Rev. Mod. Phys. 81, 1229–1285 (2009).
    1. Leemans W. P. et al. GeV electron beams from a centimetre-scale accelerator. Nat. Phys. 2, 696–699 (2006).

Publication types