. 2013 Jun 11;6(279):ra46.
doi: 10.1126/scisignal.2003755.

Mechanosensitive ATP release maintains proper mucus hydration of airways

Affiliations

Mechanosensitive ATP release maintains proper mucus hydration of airways

Brian Button et al. Sci Signal. .

Abstract

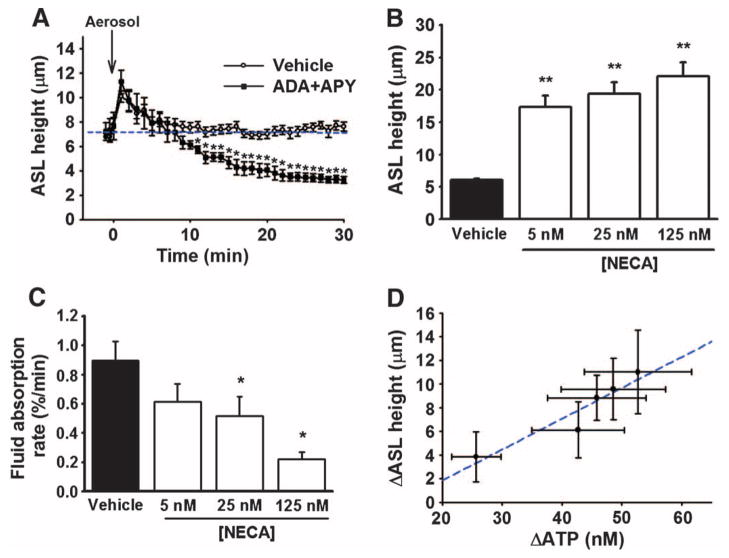
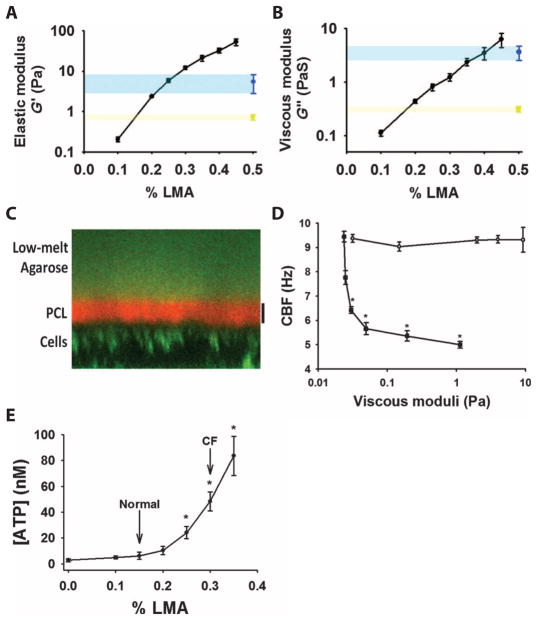
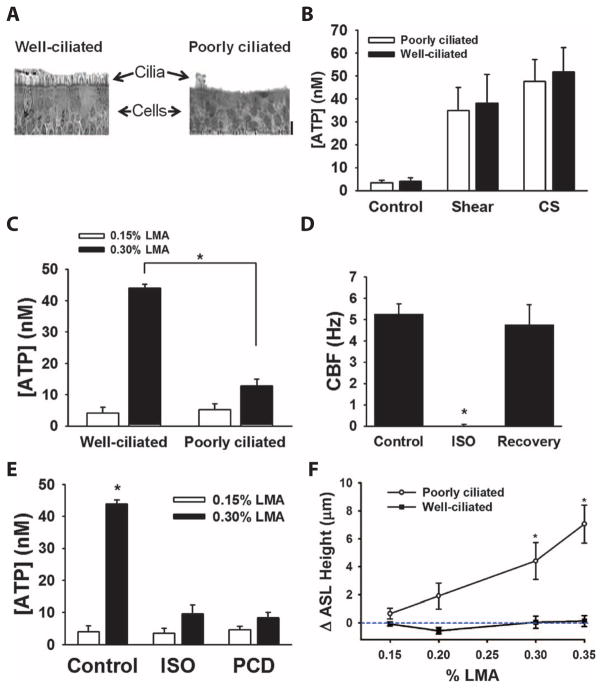
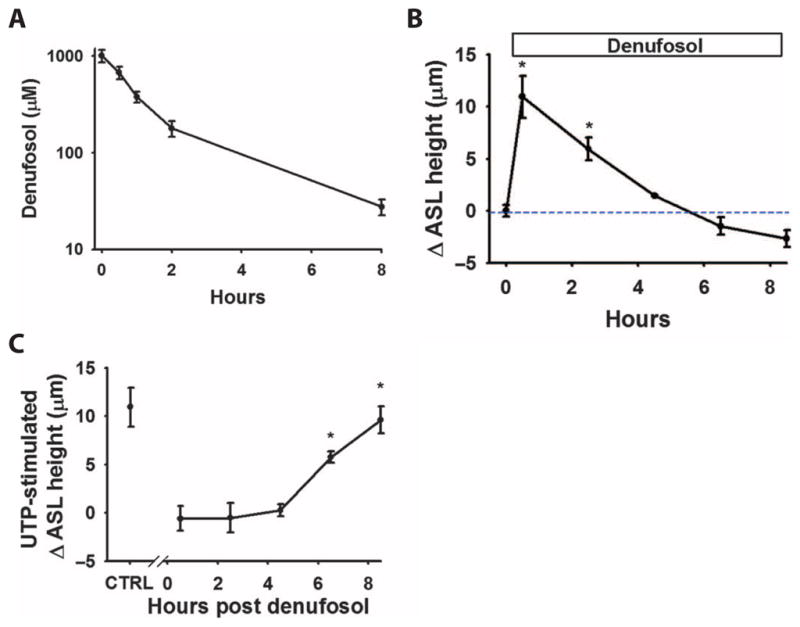
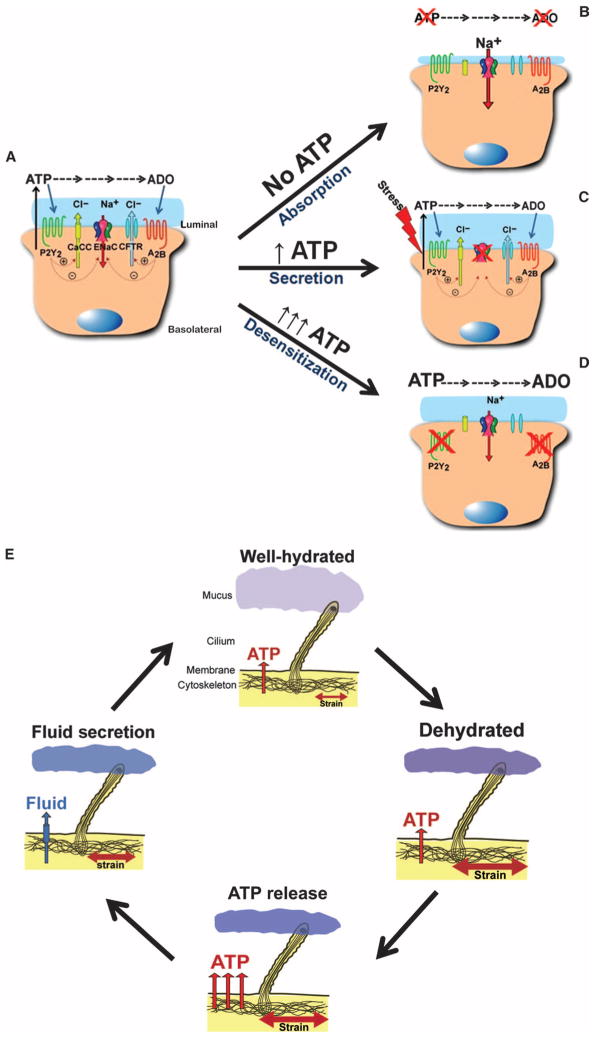
The clearance of mucus from the airways protects the lungs from inhaled noxious and infectious materials. Proper hydration of the mucus layer enables efficient mucus clearance through beating of cilia on airway epithelial cells, and reduced clearance of excessively concentrated mucus occurs in patients with chronic obstructive pulmonary disease and cystic fibrosis. Key steps in the mucus transport process are airway epithelia sensing and responding to changes in mucus hydration. We reported that extracellular adenosine triphosphate (ATP) and adenosine were important luminal autocrine and paracrine signals that regulated the hydration of the surface of human airway epithelial cultures through their action on apical membrane purinoceptors. Mucus hydration in human airway epithelial cultures was sensed by an interaction between cilia and the overlying mucus layer: Changes in mechanical strain, proportional to mucus hydration, regulated ATP release rates, adjusting fluid secretion to optimize mucus layer hydration. This system provided a feedback mechanism by which airways maintained mucus hydration in an optimum range for cilia propulsion. Understanding how airway epithelia can sense and respond to changes in mucus properties helps us to understand how the mucus clearance system protects the airways in health and how it fails in lung diseases such as cystic fibrosis.


Conflict of interest statement

Competing interests: The authors declare that they have no competing interests.

Figures

Fig. 1
Fig. 1. ATP and adenosine as regulators of airway surface hydration
(A) Effect of removing endogenous ATP and adenosine by nebulizing vehicle alone (PBS; open circle) or PBS containing apyrase (APY) and adenosine deaminase (ADA) (closed square). Steady-state fluid absorption from the luminal surface was reestablished a few minutes after nebulization in vehicle-treated cultures (blue line), but not in cultures treated with APY and ADA. Data are means ± SE from six cultures per group. *P < 0.05 compared to vehicle alone. (B) Comparison of ASL heights after addition of PBS alone (vehicle) and presence of various concentrations of NECA. Data are means ± SE from three cultures per group. **P < 0.001 compared to vehicle alone. (C) Comparison of the fluid absorption rate in the absence (vehicle; PBS) and presence of various concentrations of a nonhydrolyzable adenosine analog (NECA). Data represent the rate of change in ASL height calculated over the first 60 min after volume addition. Data are presented as a percentage of the peak ASL height change after the addition of 25-μl volume. Data are means ± SE from three cultures per group. *P < 0.005 compared to vehicle alone. (D) Relationship between the magnitude of changes in luminal ATP concentrations and ASL height. Human airway cultures were subjected to varying degrees of oscillatory stress before measuring luminal [ATP] and steady-state ASL height. These data revealed a direct relationship between ATP and changes in ASL height (correlation coefficient = 0.95 and slope = 0.3 μm height per steady-state change in ATP concentration).
Fig. 2
Fig. 2. Airways sense and respond to changes in surface viscoelasticity
(A and B) Results from a cone-and-plate rheometer show the effect of changes in the concentration of LMA on the (A) elastic modulus (G′) and (B) viscous modulus (G″). Comparison values for the G′ and G″ of native mucus are shown for both normal mucus (yellow; ~2% solids) and cystic fibrosis–like mucus (blue; ~8% solids). Data are means ± SE from three to five samples per condition. (C) Sample ZX confocal micrograph showing the distinct layering of fluorescently labeled LMA (0.45%) (green layer at top) from the periciliary layer (PCL) (labeled with Texas Red dextran 6 kD). Airway epithelial cells were labeled green using calcein AM. Scale bar, 7 μm. (D) Comparison of the effects of LMA (open circles, concentration range: 0.1 to 0.45%) and low–molecular weight dextran (closed squares, ~6 kD, concentration range: 1.0 to 30%) on CBF over a wide range of viscous moduli. Unlike dextrans, LMA does not penetrate the periciliary layer, which results in a slowing of the CBF. Data are means ± SE from three cultures per group. *P < 0.05 compared to vehicle alone. (E) Relationship between the concentration of luminal ATP and the concentration of LMA added to the airway surface. Concentrations approximating the viscoelasticity of normal (2% solids) and cystic fibrosis (CF; 8% solids) mucus are shown for comparison (21). Data are means ± SE from six to eight cultures per point. *P < 0.05 compared to vehicle (0% LMA).
Fig. 3
Fig. 3. Role of motile cilia and cilia beating in viscoelastic sensing
(A) Representative sections of (left) well-ciliated and (right) poorly ciliated airway cultures stained with hematoxylin and eosin. Scale bar, 20 μm. (B) Comparison of the steady-state ASL concentrations of ATP measured in poorly ciliated (open bars) and well-ciliated (closed bars) cultures under control (static) conditions, apical shear stress (0.5 dynes/cm2) (9), or compressive stress (CS; 20 cmH2O) (10). Data are means ± SE from five to six cultures per group. (C) Role of cilia in the ability of airway cells to sense viscoelas-ticity of the overlying surface. ATP was measured after exposure of either 0.15% LMA (open bars) or 0.3% LMA (closed bars) in well-ciliated and poorly ciliated cultures. Data are means ± SE from six to eight cultures per group. *P < 0.05 between groups. (D) Magnitude of cilia beating in normal airway cultures before, immediately after pretreatment with isoflurane (ISO), and 15 min after wash-off (recovery). Data are means ± SE from 6 to 12 cultures per group. *P < 0.001 between groups. (E) Data summarizing the role of cilia beating in control, isoflurance-treated (ISO), and primary ciliary dyskinesia (PCD) airway cultures exposed to 0.15% LMA (open bars) and 0.3% LMA (closed bars). Data are means ± SE from three cultures per group. *P < 0.05 between groups. (F) Relationship between the change in ASL height and concentration of LMA for both poorly ciliated and well-ciliated cultures. Data are plotted as the difference in ASL height between the LMA relative and a vehicle control (PBS) at 30 min after exposure. In the absence of agarose (PBS control), the average ASL height at 30 min was 8.2 ± 0.3 μm for the well-ciliated and 6.1 ± 0.4 μm for the poorly ciliated group. Data are means ± SE from three cultures per point. *P < 0.05 compared to the initial measurement.
Fig. 4
Fig. 4. Desensitization protects the airways from excessive puriner-gic stimulation
(A) Pharmaco-kinetic data showing the lifetime of denufosol concentration on the surface of the airways. Data are means ± SE from three cultures per point. (B) Summary of the effect of purinoceptor desensitization on nucleotide-stimulated changes in ASL fluid secretion. Changes in ASL height (from baseline) were measured at various times after the addition of denufosol. Data are means ± SE from three to six cultures per group. *P < 0.005 compared to the initial (t = 0) measurement. (C) In parallel cultures, also treated with denufosol, the effect of UTP (100 μM) on ASL height was determined. At earlier time points (<4 hours), UTP was ineffective at altering ASL height as compared to the control (minus denufosol) point. Data are means ± SE from three to six cultures per group. *P < 0.005 compared to the initial (t = 0) measurement.
Fig. 5
Fig. 5. Hypothetical models of ASL volume regulation
Predicted model of ASL regulation by differing conditions of ASL [ATP]. (A) Basal regulation of ASL height under normal conditions of ATP release and subsequent regulation of ion transporters. (B) In the absence of ATP and adenosine, the epithelium absorbs fluid because of the absence of Cl secretion and the inability to regulate Na+ absorption. (C) During increases in ATP release (for example, shear stress), ASL height is increased as a result of increased Cl secretion and inhibition of Na+ absorption. (D) Under conditions of excessive ATP release, purinoceptors desensitize, resulting in cessation of fluid secretion and prevention of airway flooding. (E) Proposed feedback model of stimulation of ATP release and subsequent fluid secretion by increased membrane stress during conditions of increased mucus concentration. Increased mucus concentration is sensed by beating cilia and leads to increased fluid secretion through ATP release. Once the mucus is rehydrated and has a lower viscoelasticity, the stress on the cilia is reduced, ATP release is decreased, and fluid homeostasis returns to the normal state.

References

    1. Randell SH, Boucher RC. University of North Carolina Virtual Lung Group, Effective mucus clearance is essential for respiratory health. Am J Respir Cell Mol Biol. 2006;35:20–28. - PMC - PubMed
    1. Paisley D, Gosling M, Danahay H. Regulation of airway mucosal hydration. Expert Rev Clin Pharmacol. 2010;3:361–369. - PubMed
    1. Xia B, Royall JA, Damera G, Sachdev GP, Cummings RD. Altered O-glycosylation and sulfation of airway mucins associated with cystic fibrosis. Glycobiology. 2005;15:747–775. - PubMed
    1. Kreda SM, Davis CW, Rose MC. CFTR, mucins, and mucus obstruction in cystic fibrosis. Cold Spring Harb Perspect Med. 2012;2:a009589. - PMC - PubMed
    1. Quinton PM. Role of epithelial HCO3- transport in mucin secretion: Lessons from cystic fibrosis. Am J Physiol Cell Physiol. 2010;299:C1222–C1233. - PMC - PubMed

Publication types

MeSH terms