. 2013 Aug 1;305(3):E405-15.
doi: 10.1152/ajpendo.00057.2013. Epub 2013 Jun 11.

Mitochondrial uncoupling in skeletal muscle by UCP1 augments energy expenditure and glutathione content while mitigating ROS production

Affiliations

Mitochondrial uncoupling in skeletal muscle by UCP1 augments energy expenditure and glutathione content while mitigating ROS production

Cyril Nii-Klu Adjeitey et al. Am J Physiol Endocrinol Metab. .

Abstract

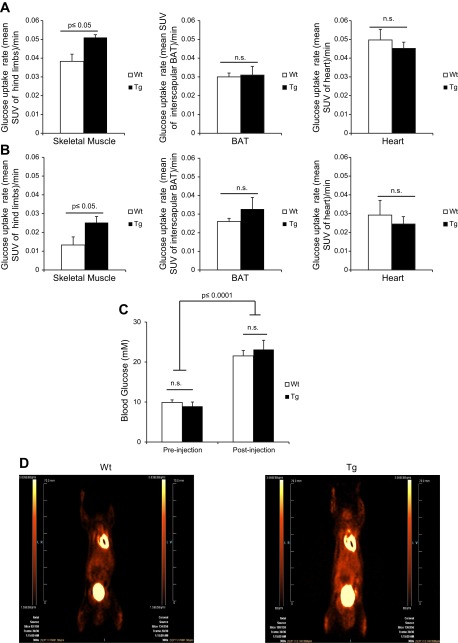
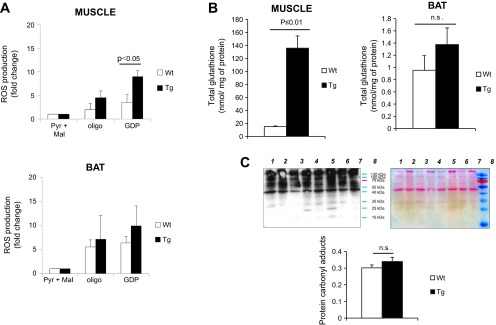
Enhancement of proton leaks in muscle tissue represents a potential target for obesity treatment. In this study, we examined the bioenergetic and physiological implications of increased proton leak in skeletal muscle. To induce muscle-specific increases in proton leak, we used mice that selectively express uncoupling protein-1 (UCP1) in skeletal muscle tissue. UCP1 expression in muscle mitochondria was ∼13% of levels in brown adipose tissue (BAT) mitochondria and caused increased GDP-sensitive proton leak. This was associated with an increase in whole body energy expenditure and a decrease in white adipose tissue content. Muscle UCP1 activity had divergent effects on mitochondrial ROS emission and glutathione levels compared with BAT. UCP1 in muscle increased total mitochondrial glutathione levels ∼7.6 fold. Intriguingly, unlike in BAT mitochondria, leak through UCP1 in muscle controlled mitochondrial ROS emission. Inhibition of UCP1 with GDP in muscle mitochondria increased ROS emission ∼2.8-fold relative to WT muscle mitochondria. GDP had no impact on ROS emission from BAT mitochondria from either genotype. Collectively, these findings indicate that selective induction of UCP1-mediated proton leak in muscle can increase whole body energy expenditure and decrease adiposity. Moreover, ectopic UCP1 expression in skeletal muscle can control mitochondrial ROS emission, while it apparently plays no such role in its endogenous tissue, brown fat.

Keywords: UCP1; glutathione; obesity; proton leak; reactive oxygen species; redox.


Figures

Fig. 1.
Fig. 1.
UCP1 expression in muscle and effects on body composition. A: mRNA and protein measurement of UCP1. B: body weight. C: gonadal white adipose tissue (gWAT) weight. D: skeletal muscle (pooled limbs) weight. E: assessment of gastrocnemius muscle fiber type composition. MHC I and II band intensities were quantified using Image J software and normalized to α-tubulin loading control; n = 4, means ± SE, Student's t-test. F: interscapular brown adipose tissue (BAT) weight. G: body length (cm). WT, wild-type; Tg, transgenic muscle creatine kinase (MCK)-UCP1; n = 9, means ± SE, Student's t-test. n.s., not significant.
Fig. 2.
Fig. 2.
Ectopic UCP1 expression increases energy expenditure without compromising acute adaptation to cold. A: daily food intake (g·day−1·g body wt−1) over a period of 4 wk; n = 4, means ± SE, Student's t-test. B: measurement of whole body energetics in WT and Tg mice housed at room temperature (22–23°C). V̇o2 (ml·kg−1·h−1) was measured by indirect calorimetry. V̇o2 was calculated for both light and dark cycles and was normalized to lean muscle mass. C: V̇o2 (ml·kg−1·h−1) of WT and Tg mice exposed to cold (4°C) for 24 h. Experiment and data analysis were conducted as described in B; n = 9, means ± SE, Student's t-test.
Fig. 3.
Fig. 3.
UCP1 expression in muscle increases oxidation of carbohydrates vs. fat in Tg mice in the dark phase. Respiratory exchange ratio (RER) results were determined for WT and Tg mice housed at room temperature (22–23°C; A) or exposed to cold (4°C; B) for 24 h. RER values were calculated for both light and dark phases; n = 9, means ± SE, Student's t-test.
Fig. 4.
Fig. 4.
UCP1 expression in muscle increases the rate of glucose uptake. WT and Tg mice were anesthetized and injected with [18F]FDG tracer at a constant rate of infusion (1.66 μl·MBq−1·min−1) and imaged using PET for 80 min. At 20 min following injection of [18F]FDG, mice were injected with norepinephine (NE) at a dose of 1 mg/kg body wt. Pre-NE, values before NE treatment; post-NE, values after NE treatment. Mean standardized uptake values (SUV) = [18F]FDG uptake/injected activity × body weight (g/ml) as determined from regions of interest in hindlimb and forelimb muscle of Tg and WT mice. Rate of glucose uptake was measured post-NE injection. Rate of glucose uptake was determined pre-NE (A) and post-NE (B) in muscle, IBAT, and heart. C: blood glucose levels were measured pre- and postinjection of NE. Statistical analysis was done using two-way ANOVA with Fischer post hoc test; n = 5. D: coronal [18F]FDG PET images collected from WT and Tg mice; n = 5, means ± SE, Student's t-test.
Fig. 5.
Fig. 5.
UCP1 induces proton leak in muscle mitochondria without compromising ADP-stimulated oxidative phosphorylation. Bioenergetics of isolated mitochondria from skeletal muscle and BAT of WT and Tg mice were tested using the Seahorse XF24 Analyzer, as described in materials and methods. A: measurement of GDP-sensitive proton leak in muscle and BAT mitochondrial preparations from WT and Tg mice. Following measurement of state 2 respiration (10 mM pyruvate and 2 mM malate only), mitochondria were treated with oligomycin followed by GDP titration (0.1–0.2 mM for muscle and 0.5–1 mM for BAT mitochondria). B: assessment of oxidative phosphorylation. Following measurement of state 2 respiration, mitochondria were treated sequentially with ADP (0.1 mM; state 3), oligomycin (2.5 μg/ml; state 4 O), FCCP (8 μM), and antimycin A (4 μM); n = 3, means ± SE. V̇o2 rates were normalized to fold change relative to state 2 respiration rates. Two-way ANOVA with Fischer post-hoc test: *P ≤ 0.05, **P ≤ 0.01 for treatments vs. state 2; #P ≤ 0.01 for between genotypes.
Fig. 6.
Fig. 6.
UCP1 lowers mitochondrial ROS emission from muscle but not BAT mitochondria. A: ROS emission measurements from mitochondria isolated from skeletal muscle and BAT of WT and Tg mice. Assays were initiated by addition of 5 mM pyruvate and 3 mM malate (Pyr+Mal) followed by sequential addition of oligomycin (1.3 μg/ml) and saturating amounts of GDP (1 mM). ROS production was measured for ∼10 min after each treatment using H2-DCFDA. B: total glutathione content in skeletal muscle and BAT mitochondria isolated from WT and Tg mice. Measurement of glutathione was conducted as described in materials and methods; n = 3, means ± SE, Student's t-test. C: detection of total protein carbonyl adducts in gastrocnemius muscle extracted from WT and Tg mice. Lanes 1, 3, 5, and 7 correspond to WT; lanes 2, 4, 6, and 8 correspond to Tg. Protein carbonyls were detected using the Oxyblot assay kit. Ponceau S staining of membranes served as loading control. Lane intensities were quantified using Image J software; n = 4, means ± SE, Student's t-test.

References

    1. Affourtit C, Crichton PG, Parker N, Brand MD. Novel uncoupling proteins. Novartis Foundation Symp 287: 70–80; discussion 80–91, 2007 - PubMed
    1. Azzu V, Brand MD. The on-off switches of the mitochondrial uncoupling proteins. Trends Biochem Sci 35: 298–307, 2010 - PMC - PubMed
    1. Cannon B, Shabalina IG, Kramarova TV, Petrovic N, Nedergaard J. Uncoupling proteins: a role in protection against reactive oxygen species—or not? Biochim Biophys Acta 1757: 449–458, 2006 - PubMed
    1. Clapham JC, Arch JR, Chapman H, Haynes A, Lister C, Moore GB, Piercy V, Carter SA, Lehner I, Smith SA, Beeley LJ, Godden RJ, Herrity N, Skehel M, Changani KK, Hockings PD, Reid DG, Squires SM, Hatcher J, Trail B, Latcham J, Rastan S, Harper AJ, Cadenas S, Buckingham JA, Brand MD, Abuin A. Mice overexpressing human uncoupling protein-3 in skeletal muscle are hyperphagic and lean. Nature 406: 415–418, 2000 - PubMed
    1. Clarke KJ, Porter RK. Uncoupling protein 1 dependent reactive oxygen species production by thymus mitochondria. Int J Biochem Cell Biol 45: 81–89, 2013 - PubMed

Publication types

MeSH terms

LinkOut - more resources