Review
. 2013 Sep;10(3):401-21.
doi: 10.1089/zeb.2013.0886. Epub 2013 Jun 12.

Automated processing of zebrafish imaging data: a survey

Affiliations
Review

Automated processing of zebrafish imaging data: a survey

Ralf Mikut et al. Zebrafish. 2013 Sep.

Abstract

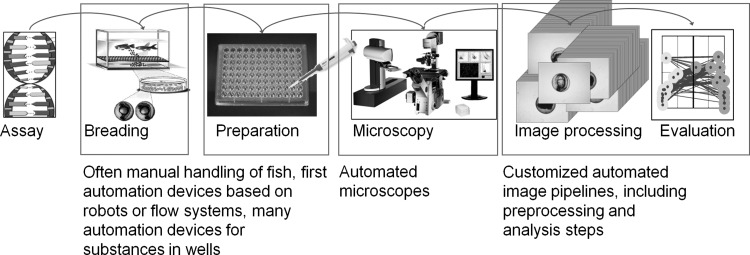
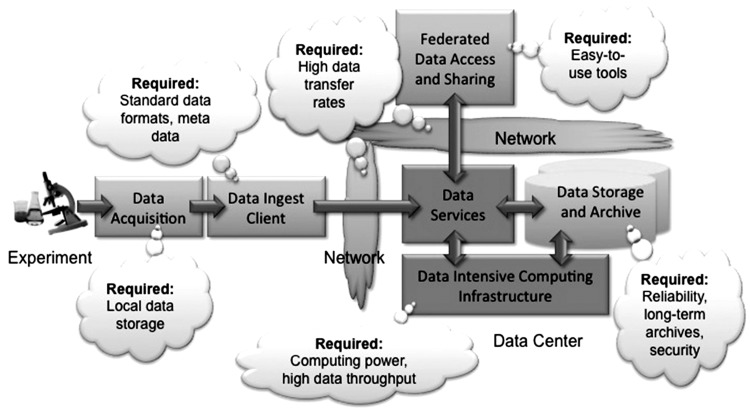
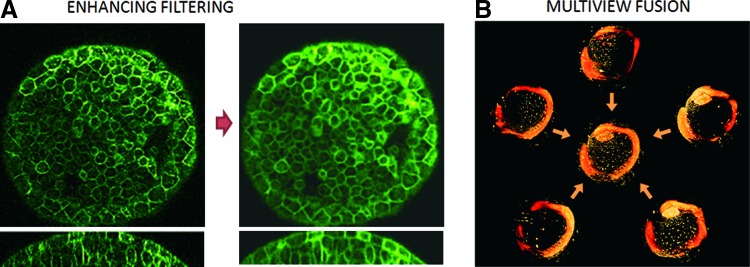
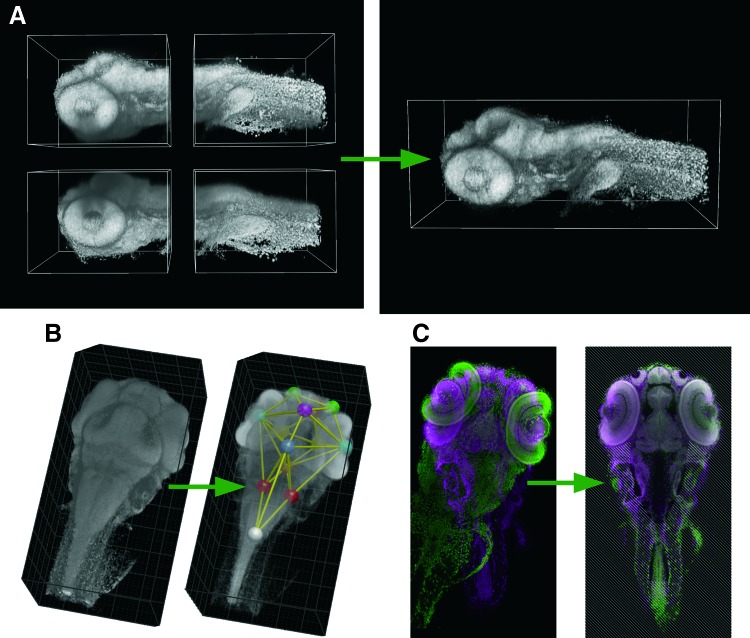
Due to the relative transparency of its embryos and larvae, the zebrafish is an ideal model organism for bioimaging approaches in vertebrates. Novel microscope technologies allow the imaging of developmental processes in unprecedented detail, and they enable the use of complex image-based read-outs for high-throughput/high-content screening. Such applications can easily generate Terabytes of image data, the handling and analysis of which becomes a major bottleneck in extracting the targeted information. Here, we describe the current state of the art in computational image analysis in the zebrafish system. We discuss the challenges encountered when handling high-content image data, especially with regard to data quality, annotation, and storage. We survey methods for preprocessing image data for further analysis, and describe selected examples of automated image analysis, including the tracking of cells during embryogenesis, heartbeat detection, identification of dead embryos, recognition of tissues and anatomical landmarks, and quantification of behavioral patterns of adult fish. We review recent examples for applications using such methods, such as the comprehensive analysis of cell lineages during early development, the generation of a three-dimensional brain atlas of zebrafish larvae, and high-throughput drug screens based on movement patterns. Finally, we identify future challenges for the zebrafish image analysis community, notably those concerning the compatibility of algorithms and data formats for the assembly of modular analysis pipelines.


Figures

FIG. 1.
FIG. 1.
A typical workflow for HTS with the zebrafish as a model organism (modified from Alshut et al.).
FIG. 2.
FIG. 2.
Data workflow in a large high-throughput screen.
FIG. 3.
FIG. 3.
(A) Cross-sections of a zebrafish embryo image filtered following the approach by Luengo-Oroz. Left: Cross-sections of the original image. Right: Cross-sections of the image filtered by an enhancing (3D+time) multidirectional method. (B) Rendering of the fusion of five light sheet fluorescence microscopy views acquired for a zebrafish embryo using the wavelet approach by Rubio-Guivernau et al. Renderings of the individual views are shown in a smaller scale around the fusion. Color images available online at www.liebertpub.com/zeb
FIG. 4.
FIG. 4.
High dynamic range (HDR) fusion. Upper panels: Raw and processed images. Lower panels: Gray value profile extracted along the blue line (corresponding positions marked by red arrows in (A) and (B)). (A) Recording with low laser intensity. No over-exposure, but partially bad signal-to-noise-ratio (SNR). (B) Recording with high laser intensity. Partial over-exposure (highlighted in red), but good SNR. (C) After HDR fusion: no over-exposure, good SNR. Color images available online at www.liebertpub.com/zeb
FIG. 5.
FIG. 5.
Image analysis in ViBE-Z: (A) Stitching and multi-view fusion with attenuation correction creates a high-quality data set of a 72 hpf zebrafish larva. (B) Automated landmark detection. (C) Landmark-initialized elastic registration of subject (green) to the reference brain (magenta). Color images available online at www.liebertpub.com/zeb
FIG. 6.
FIG. 6.
Example for a phenotype recognition screen including (A) a sample image of a living embryo in a microtiter plate well, (B) a sample image of a dead embryo, (C) three examples for living and dead (necrotic) embryos in different orientations and after extraction from the well image, (D) the result of image processing and evaluation based on features automatically extracted from the images. The y-axis gives values for the center of mass of the gray value histogram, and the x-axis indicates the mean intensity value in the chorion center. These two values allow an almost error-free classification. Each plotted symbol indicates a necrotic (“coagulated,” red points) or living (“alive,” green circles) embryo as evaluated by manual annotation. The gray line gives the cut-off line separating fields for automated classification of necrotic and live embryos. Color images available online at www.liebertpub.com/zeb
FIG. 7.
FIG. 7.
Reconstruction of zebrafish early embryonic development from multiharmonic imaging data. (A) Top: three orthogonal views of an original dataset combining third harmonic generation (THG; blue) and second harmonic generation (SHG; green). Bottom: THG and SHG details. (B) Cell segmentation after application of a viscous watershed algorithm. Top: viscous filtering applied to the original SHG image. Bottom: resultant cell segmentation. (C) The SHG channel is used to identify cell mitosis, and the integration with the cell segmentation enables cell linage reconstruction (top) and the representation of the spatial deployment of the cell lineage tree (bottom). (A, B) are partly from Luengo-Oroz et al. and (C) from Olivier et al., reprinted with permission. Color images available online at www.liebertpub.com/zeb
FIG. 8.
FIG. 8.
Automated cell lineage reconstruction and cell cycle length analysis in the presumptive zebrafish brain. (A) Animal pole view of the zebrafish brain by early somitogenesis. Anterior is bottom right and posterior top left. Cell trajectories in the forebrain and midbrain are assessed through the processing of a 3D+time image data set with a mosaic staining obtained through the transplantation of cells with red and green nuclei into a host embryo with green nuclei. The complete cell lineage of the “red nuclei” population has been reconstructed. Reconstructed and raw data (in white) are superimposed with the Mov-IT visualization interface. Red lines mark cell trajectories throughout the whole spatiotemporal sequence. Blue cubes indicate the approximate center of nuclei. Scale bar is 100 μm (B). Similar to data as in (A), each dot indicates a cell division observed at a given developmental time (in hours postfertilization at 26°C), and is plotted as a function of the time elapsed since its birth through its mother's division. The cell cycle lengthens linearly (in min) from 2 to 5 h. The data set and tracking identification numbers are indicated top right. This information is a part of the metadata of the experiment (BioEmergences platform, unpublished). Color images available online at www.liebertpub.com/zeb
FIG. 9.
FIG. 9.
The Virtual Brain Explorer for Zebrafish (ViBE-Z) provides a web-based interface to register 3D datasets recorded by a standardized procedure to an anatomical reference model. (A, C, E) Shows expression data channels of a single longitudinal dorsoventral focal plane from three different 3 day old larval brains (anterior to the left; otpb:gfp and nkx2.2a;GFP immunofluorescence and tbr1b whole mount in situ hybridization) along with lines delimiting anatomical brain regions. (B) Shows the fluorescent nuclear staining pattern used for registration to the reference larvae. (D) Shows superimposition of the three expression data channels and the nuclear stain in the same dorsoventral plane. (F) Shows color coded anatomical domains with color code given on the right. Color images available online at www.liebertpub.com/zeb

References

    1. Detrich HW., III Westerfield M. Zon LI. third. Academic Press; Waltham, MA: 2011. The Zebrafish: Disease Models and Chemical Screens.
    1. Yang LX. Ho NY. Alshut R. Legradi J. Weiss C. Reischl M, et al. Zebrafish embryos as models for embryotoxic and teratological effects of chemicals. Reprod Toxicol. 2009;28:245–253. - PubMed
    1. Bakkers J. Zebrafish as a model to study cardiac development and human cardiac disease. Cardiovasc Res. 2011;91:279–288. - PMC - PubMed
    1. Mione MC. Trede NS. The zebrafish as a model for cancer. Dis Model Mech. 2010;3:517–23. - PMC - PubMed
    1. Flinn L. Bretaud S. Lo C. Ingham PW. Bandmann O. Zebrafish as a new animal model for movement disorders. J Neurochem. 2008;106:1991–1997. - PubMed

Publication types