. 2013 Jun 11:8:141.
doi: 10.1186/1748-717X-8-141.

Engineering cell-fluorescent ion track hybrid detectors

Affiliations

Engineering cell-fluorescent ion track hybrid detectors

Martin Niklas et al. Radiat Oncol. .

Abstract

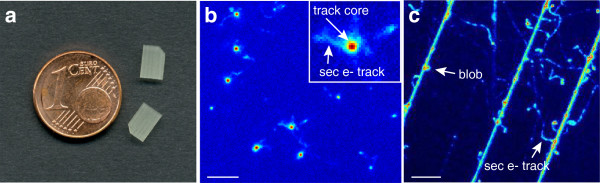
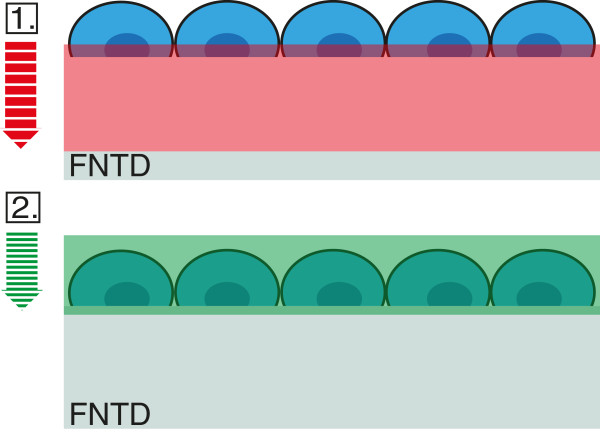
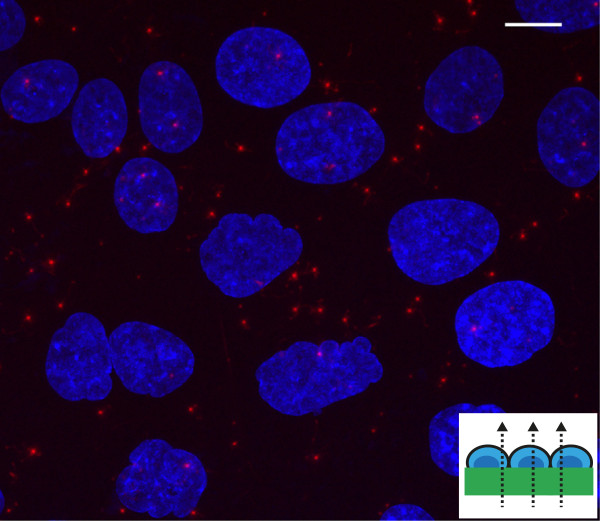
Background: The lack of sensitive biocompatible particle track detectors has so far limited parallel detection of physical energy deposition and biological response. Fluorescent nuclear track detectors (FNTDs) based on Al₂O₃:C,Mg single crystals combined with confocal laser scanning microscopy (CLSM) provide 3D information on ion tracks with a resolution limited by light diffraction. Here we report the development of next generation cell-fluorescent ion track hybrid detectors (Cell-Fit-HD).

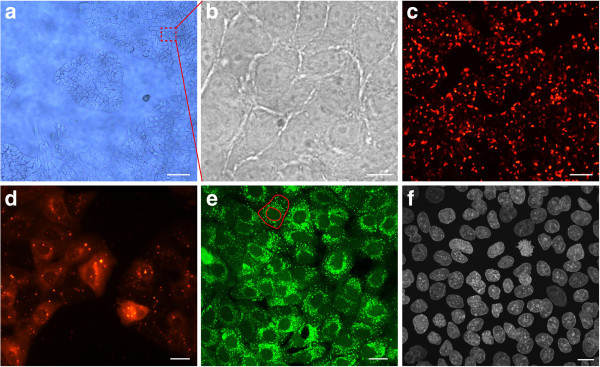
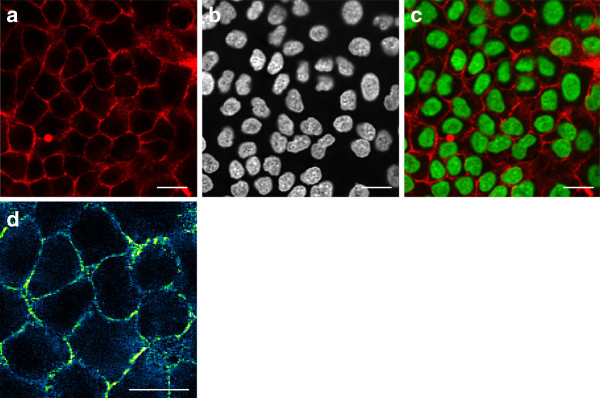
Methods: The biocompatibility of FNTDs was tested using six different cell lines, i.e. human non-small cell lung carcinoma (A549), glioblastoma (U87), androgen independent prostate cancer (PC3), epidermoid cancer (A431) and murine (VmDk) glioma SMA-560. To evaluate cell adherence, viability and conformal coverage of the crystals different seeding densities and alternative coating with extracellular matrix (fibronectin) was tested. Carbon irradiation was performed in Bragg peak (initial 270.55 MeV u⁻¹). A series of cell compartment specific fluorescence stains including nuclear (HOECHST), membrane (Glut-1), cytoplasm (Calcein AM, CM-DiI) were tested on Cell-Fit-HDs and a single CLSM was employed to co-detect the physical (crystal) as well as the biological (cell layer) information.

Results: The FNTD provides a biocompatible surface. Among the cells tested, A549 cells formed the most uniform, viable, tightly packed epithelial like monolayer. The ion track information was not compromised in Cell-Fit-HD as compared to the FNTD alone. Neither cell coating and culturing, nor additional staining procedures affected the properties of the FNTD surface to detect ion tracks. Standard immunofluorescence and live staining procedures could be employed to co-register cell biology and ion track information.

Conclusions: The Cell-Fit-Hybrid Detector system is a promising platform for a multitude of studies linking biological response to energy deposition at high level of optical microscopy resolution.


Figures

Figure 1
Figure 1
Fluorescent nuclear track detector (FNTD). (a) Two FNTDs (8 × 4 × 0.5 mm3). Courtesy of M.S. Akselrod, Landauer Crystal Growth Division. (b) Fluorescent image of the 270.55 MeV u −1 carbon-ion tracks propagating perpendicular to the FNTD crystal surface. The brightest spots (physical energy deposition events) are attributed to carbon ions with a full width half maximum (FWHM) of approximately 500 nm [9]. The smaller, less intense spots to less densely ionizing particles like protons. The small structures around the carbon ion tracks arise from secondary electrons (sec e-) [10]. Insert: magnification of a single track spot. The track core is encoded by dark red. Scale bar, 5 μm. (c) FNTD image after carbon irradiation (initial 270.5 MeV u −1) parallel to the polished crystal surface. Secondary electron structures (small trajectories branching from the ion track) are visible. Instead of homogeneous energy deposition discrete blobs (bright spots) occur along the particle tracks. This is an illustration of stochastic nature of energy deposition along the heavy charged particle track. Courtesy of F. Lauer. Scale bar, 5 μm.
Figure 2
Figure 2
A549 cell coating. (a) A549 cells cultured on the FNTD crystal surface starting to form a confluent monolayer. A typical island formation with branching cells is clearly visible. Scale bar, approximately 200 μm (b) Magnified section of a confluent monolayer. The cells are tightly packed. It is difficult to contrast cells from the transparent crystal substrate with light microscopy. Scale bar, 10 μm. (c) CM-DiI labeled and proliferating cells forming a confluent monolayer. Scale bar, approximately 200 μm (d) Section of CM-DiI labeled monolayer reveals clear cytoplasmic coloring. Cytoplasmic granules (multilamellar bodies) exhibit a strong fluorescent signal. Scale bar, approximately 20 μm. (e) Cell layer is labeled with Calcein AM to test cell viability. The outer red line indicates the cell membrane. The cell nucleus is defined by the inner red line. A strong perinuclear fluorescent signal with many bright spots (cytoplasmic organelles) and round nuclei indicate good cell viability. Scale bar, 20 μm. (f) Immunofluorescent labeling of cell nuclei by HOECHST 33342 stain. A uniform monolayer of proliferating cells is visible. Scale bar, 10 μm. Images (a), (c), and (d) were obtained by wide field microscopy whereas images (b, e, and f) were obtained in confocal fluorescent mode. Images (a)-(e) show live cell stainings. In (f) cells are fixed with 4% PFA.
Figure 3
Figure 3
Membrane and nuclear staining of A549 Cell-Fit-HD. (a) Glucose transporter Glut1 staining visualizes the A549 cell membrane. Glut1 is mainly accumulated at the membrane. The diffuse cytoplasmic signal may arise from permeabilisation during immunofluorescent staining. (b) HOECHST staining as nuclear counterstain. (c) Merging of Glut1 and HOECHST images. A549 cells form a tightly packed monolayer with strong cell-cell adhesion. (d) A section of (a) with different color coding (blue-green-yellow) is shown. The distinct yellow bright spots indicate a discrete strong accumulation of Glut1 at the membrane. Scale bars, 20 μm. (a)-(d) were obtained by confocal fluorescent microscopy.
Figure 4
Figure 4
Sequential read-out of Cell-Fit-HD. To avoid photoionization of FNTD crystals the imaging is first performed with the red laser on FNTD crystal and only after that the scan continues with blue laser on stained cell layer. The total axial range for the acquired image stack is about 120 μm with depth increment (Δz) of 3 μm for FNTD crystal and Δz= 0.3 μm for the cell-layer. The axial range for the image stack of cells is about 10 μm. The difference in optical sectioning is indicated by the striped arrows.
Figure 5
Figure 5
Correlation between carbon ion tracks and A549 cell layer. Superposition of cellular response data (maximum intensity z-projection) with an image of the acquired FNTD image stack. The red spots are the ion tracks (with FWHM of approximately 500 nm [9]). The small trajectories branching from the ion tracks are tracks of secondary electrons in the FNTD crystal. The cell nuclei (depicted in blue) are labeled with HOECHST. The surface of cell-coated FNTD was set perpendicular to the incident carbon ion beam (small insert). Initial carbon ion energy was 270.55 MeV u −1 and fluence - 106 cm −2. Scale bar, 10 μm.

References

    1. Weyrather WK, Ritter S, Scholz M, Kraft G. RBE for carbon track-segment irradiation in cell lines of differing repair capacity. Int J Radiat Biol. 1999;75(11):1357–1364. doi: 10.1080/095530099139232. - DOI - PubMed
    1. Bucker H. The Biostack Experiments I and II aboard Apollo 16 and 17. Life Sci Space Res. 1974;12:43–50. - PubMed
    1. Bucker H, Horneck G, Allkofer OC, Bartholoma KP, Beaujean R, Cuer P, Enge W, Facius R, Francois H, Graul EH. et al.The Biostack experiment on Apollo 16. Life Sci Space Res. 1973;11:295–305. - PubMed
    1. Chan K, Yum E, Wan C, Fong W, Yu K. Study of DNA integrity in alpha-particle radiobiological experiments using thin CR-39 detectors. Radiat Meas. 2008;43, Suppl. 1:S541–S545. - PubMed
    1. Osinga JM, Akselrod M, Herrmann R, Hable V, Dollinger G, Jäkel O, Greilich S. High-accuracy fluence determination in ion beams using fluorescent nuclear track detectors. Radiat Meas. 2013. http://dx.doi.org/10.1016/j.radmeas.2013.01.035. - DOI

Publication types