

Cohort profile: Canadian study of prediction of death, dialysis and interim cardiovascular events (CanPREDDICT)
- PMID: 23758910
- PMCID: PMC3691726
- DOI: 10.1186/1471-2369-14-121
Cohort profile: Canadian study of prediction of death, dialysis and interim cardiovascular events (CanPREDDICT)
Abstract
Background: The Canadian Study of Prediction of Death, Dialysis and Interim Cardiovascular Events (CanPREDDICT) is a large, prospective, pan-Canadian, cohort study designed to improve our understanding of determinants of renal and cardiovascular (CV) disease progression in patients with chronic kidney disease (CKD). The primary objective is to clarify the associations between traditional and newer biomarkers in the prediction of specific renal and CV events, and of death in patients with CKD managed by nephrologists. This information could then be used to better understand biological variation in outcomes, to develop clinical prediction models and to inform enrolment into interventional studies which may lead to novel treatments.
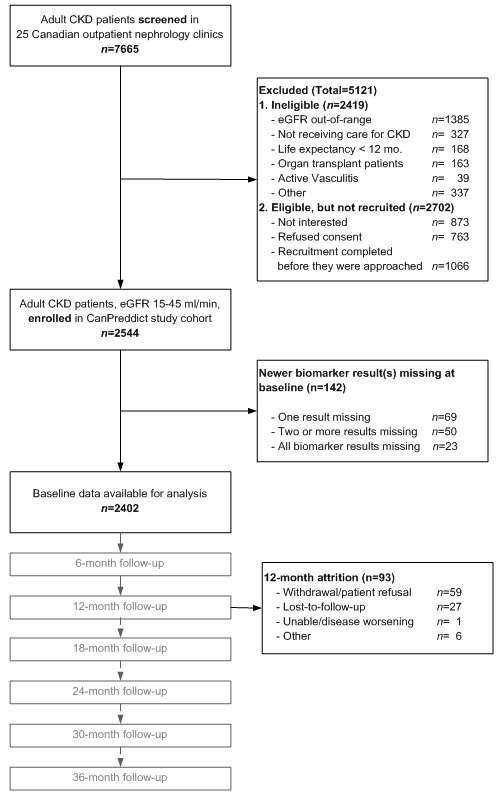
Methods/designs: Commenced in 2008, 2546 patients have been enrolled with eGFR between 15 and 45 ml/min 1.73m2 from a representative sample in 25 rural, urban, academic and non academic centres across Canada. Patients are to be followed for an initial 3 years at 6 monthly intervals, and subsequently annually. Traditional biomarkers include eGFR, urine albumin creatinine ratio (uACR), hemoglobin (Hgb), phosphate and albumin. Newer biomarkers of interest were selected on the basis of biological relevance to important processes, commercial availability and assay reproducibility. They include asymmetric dimethylarginine (ADMA), N-terminal pro-brain natriuretic peptide (NT-pro-BNP), troponin I, cystatin C, high sensitivity C-reactive protein (hsCRP), interleukin-6 (IL6) and transforming growth factor beta 1 (TGFβ1). Blood and urine samples are collected at baseline, and every 6 monthly, and stored at -80°C. Outcomes of interest include renal replacement therapy, CV events and death, the latter two of which are adjudicated by an independent panel.
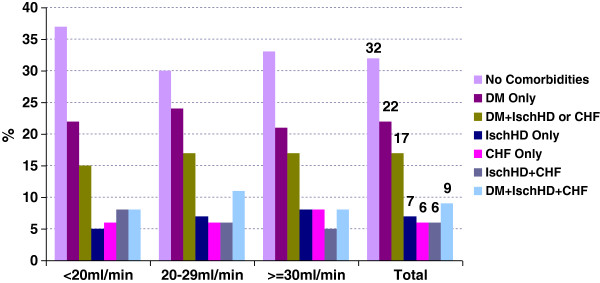
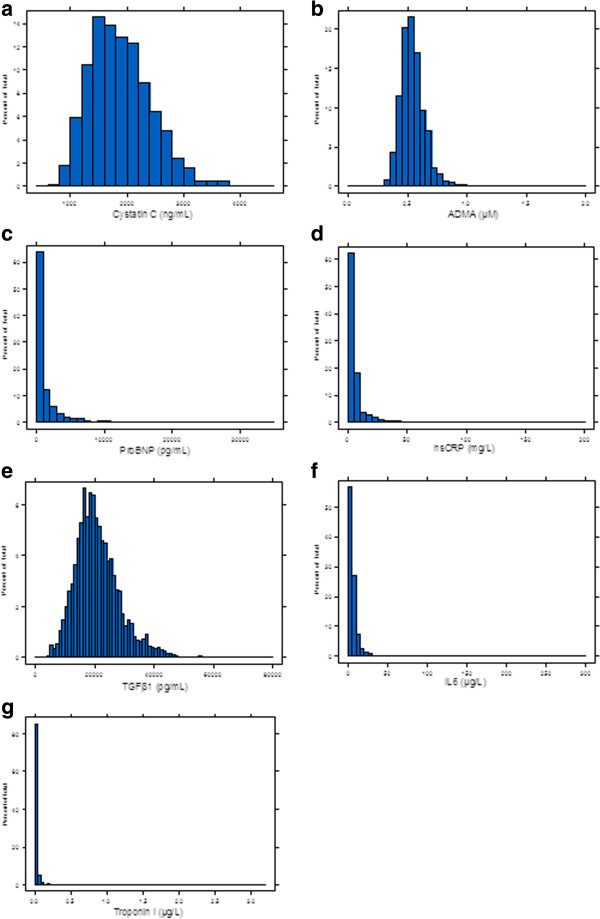
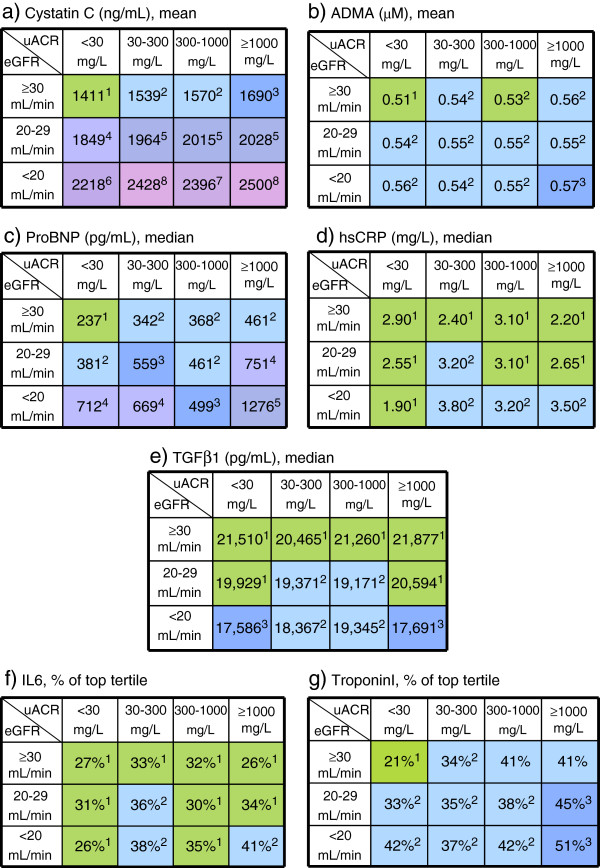
Discussion: The baseline distribution of newer biomarkers does not appear to track to markers of kidney function and therefore may offer some discriminatory value in predicting future outcomes. The granularity of the data presented at baseline may foster additional questions.The value of the cohort as a unique resource to understand outcomes of patients under the care of nephrologists in a single payer healthcare system cannot be overstated. Systematic collection of demographic, laboratory and event data should lead to new insights. The mean age of the cohort was 68 years, 90% were Caucasian, 62% were male, and 48% had diabetes. Forty percent of the cohort had eGFR between 30-45 mL/min/1.73m², 22% had eGFR values below 20 mL/min/1.73m²; 61% had uACR < 30. Serum albumin, hemoglobin, calcium and 25-hydroxyvitamin D (25(OH)D) levels were progressively lower in the lower eGFR strata, while parathyroid hormone (PTH) levels increased. Cystatin C, ADMA, NT-proBNP, hsCRP, troponin I and IL-6 were significantly higher in the lower GFR strata, whereas 25(OH)D and TGFβ1 values were lower at lower GFR. These distributions of each of the newer biomarkers by eGFR and uACR categories were variable.
Figures
References
-
- Chadban SJ, Briganti EM, Kerr PG, Dunstan DW, Welborn TA, Zimmet PZ, Atkins RC. Prevalence of kidney damage in australian adults: the AusDiab kidney study. J Am Soc Nephrol. 2003;14(7 Suppl 2):S131–S138. - PubMed
-
- Obrador GT, Garcia-Garcia G, Villa AR, Rubilar X, Olvera N, Ferreira E, Virgen M, Gutierrez-Padilla JA, Plascencia-Alonso M, Mendoza-Garcia M. et al.Prevalence of chronic kidney disease in the kidney early evaluation program (KEEP) mexico and comparison with KEEP US. Kidney Int Suppl. 2010;116:S2–S8. - PubMed
Publication types
MeSH terms
Grants and funding
LinkOut - more resources
Full Text Sources
Other Literature Sources
Medical
Research Materials
Miscellaneous
