. 2013 Jun 10:13:24.
doi: 10.1186/1471-213X-13-24.

Live imaging and analysis of postnatal mouse retinal development

Affiliations

Live imaging and analysis of postnatal mouse retinal development

Philip E B Nickerson et al. BMC Dev Biol. .

Abstract

Background: The explanted, developing rodent retina provides an efficient and accessible preparation for use in gene transfer and pharmacological experimentation. Many of the features of normal development are retained in the explanted retina, including retinal progenitor cell proliferation, heterochronic cell production, interkinetic nuclear migration, and connectivity. To date, live imaging in the developing retina has been reported in non-mammalian and mammalian whole-mount samples. An integrated approach to rodent retinal culture/transfection, live imaging, cell tracking, and analysis in structurally intact explants greatly improves our ability to assess the kinetics of cell production.

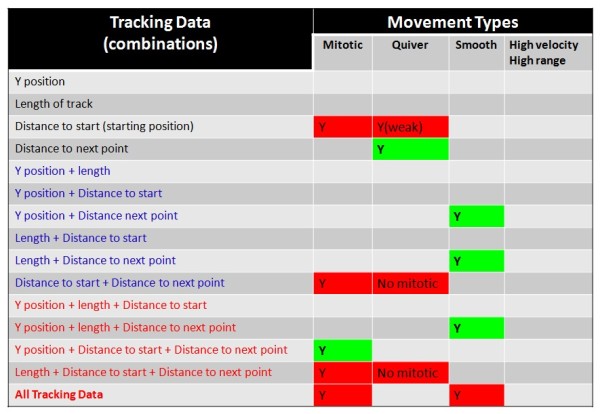
Results: In this report, we describe the assembly and maintenance of an in vitro, CO2-independent, live mouse retinal preparation that is accessible by both upright and inverted, 2-photon or confocal microscopes. The optics of this preparation permit high-quality and multi-channel imaging of retinal cells expressing fluorescent reporters for up to 48h. Tracking of interkinetic nuclear migration within individual cells, and changes in retinal progenitor cell morphology are described. Follow-up, hierarchical cluster screening revealed that several different dependent variable measures can be used to identify and group movement kinetics in experimental and control samples.

Conclusions: Collectively, these methods provide a robust approach to assay multiple features of rodent retinal development using live imaging.


Figures

Figure 1
Figure 1
Preparation and live imaging of postnatal mouse retinal explants. (A) Schematic representations of upright and inverted imaging preparations. (B) Retinal and imaging orientations for use with cellular movement and morphology analysis. P = peripheral retina; C = central retina; A = apical neuroblastic margin; B = basal neuroblastic margin. (C) An example of conventional histological data in which thymidine analogue (CldU for 30 minutes at 29.5h post-electroporation) immunolabeling provides a means to evaluate the position and morphology of s-phase and non-s-phase retinal cells expressing HuSH-scrambled shRNA-tGFP. NBL = neuroblastic layer; GCL = ganglion cell layer. (D) An example of live 2-photon imaging in retinas transfected with H2B-GFP at P0, and imaged 20h later. (E) Live, 2-channel confocal imaging of retinas co-transfected at P0 with H2B-GFP (300 ng/μl), a trace amount (50 ng/μl) of CMV-Cre, and the Cre-sensitive reporter pCALNL-dsRed (500 ng/μl; final ratio of 6:1:10). Images were acquired 48h post-transfection. (F) High magnification insets (red box in E). White arrowheads indicate variability in terminal nuclear position; magenta arrowheads indicate morphological features of cytoplasmic dsRed localization in apical processes.
Figure 2
Figure 2
Visualizing movement kinetics in the postnatal mouse retina. (A) A time series demonstrating changes in morphology and position of transfected retinal cells. Postnatal day 0 mouse retinas were co-electroporated with a nuclear-localized GFP, CMV-Cre and pCALNL-dsRed. Image acquisition began at 24h post-transfection with a 3h per frame temporal resolution. Open arrowheads indicate an emerging eGFP nucleus in the differentiating iNBL. Bracket in the final frame indicates the range of movement by a nucleus within a GFP/dsRed co-localized cell. NBL – neuroblastic layer; iNBL – inner neuroblastic layer. (B) A selection of images from a time series demonstrating mitotic events (yellow arrowheads) by H2B-GFP expressing nuclei. (C). Cell tracking histograms of nuclear movements for H2B-GFP (i.) and knockdown (ii.) retinas. Blue lines and arrows represent the largest range of movement by a single nucleus, whereas green lines and arrows represent the smallest range. Yellow arrowheads indicate mitotic events, and correspond to yellow arrowheads in (B). (iii) is a representative live frame of H2B-GFP distribution across the apical NBL margin (aNBL) and iNBL. (D) Comparison of H2B-GFP control nuclear tracing data with knockdown nuclei.
Figure 3
Figure 3
Detailed changes in nuclear morphology during retinal development. A high temporal resolution (3 minutes per frame), 2-photon image series demonstrating periodic changes in nuclear morphology during apical/basal movements. (A) A highly motile nucleus demonstrating advancing movement. Red arrowheads indicate the emergence of wisp-like protrusions in the otherwise smooth apex of an H2B-GFP expressing nucleus. (B) Immotile nuclei imaged over a 153 minute time course. Yellow arrowhead indicates a relatively static nuclear morphology exhibited by what appears to be a differentiated cell. Outline (inset in i. and ii.) depicts a rapid morphological shift from progenitor-like, to a more differentiated nuclear appearance.
Figure 4
Figure 4
Cell tracking. Representative INM traces of nuclei belonging to one of four categories of movement (Smooth, Quivering, Erratic, Mitotic) identified through visual screening. Yellow arrowheads represent mitotic events.
Figure 5
Figure 5
Identification of hierarchical cluster screening algorithms. Four types of movement data derived through cell tracking were used either independently (black text) or in 2 variable (blue) or 3 variable (red) combinations to hierarchically screen for nuclei that belong to one of the four categories of movement. Boxes containing a “Y” generate efficient clusters for that movement category. Green boxes represent exclusive clustering of cases belonging to that movement. Red boxes indicate clustering of cases from 2 or more movement categories, and were therefore, not useful for screening for individual movements.
Figure 6
Figure 6
Additional dependent measures of RPC movement kinetics correspond with increased clustering efficiencies. (A) Example of a dendrogram output generated using Distance to next point as a dependent clustering variable, for the identification of cases that exhibit a quivering movement. Longer horizontal stems and fewer higher order branching points on the dendrogram output represent stronger clustering. Asterisk indicates contamination by a case from another movement category. Red arrow indicates a quivering nucleus that underwent a mitotic event, and was therefore clustered separately. (B) Dendrogram output demonstrating efficient clustering of mitotic nuclei (green box) using 3 dependent clustering variables. (C) Evaluation of changes in INM phenotypes using hierarchical clustering. Individual nuclei from control and knockdown groups can be identified and clustered with high accuracy (control = 100%; knockdown = 96%) from a merged data set using all four dependent variable measures. The red arrowhead indicates an erroneous assignment of a knockdown case to the control cluster.

Similar articles

Cited by

References

    1. Matsuda T, Cepko CL. Electroporation and RNA interference in the rodent retina in vivo and in vitro. Proc Natl Acad Sci USA. 2004;101(1):16–22. doi: 10.1073/pnas.2235688100. - DOI - PMC - PubMed
    1. Matsuda T, Cepko CL. Controlled expression of transgenes introduced by in vivo electroporation. Proc Natl Acad Sci USA. 2007;104(3):1027–1032. doi: 10.1073/pnas.0610155104. - DOI - PMC - PubMed
    1. Matsuda T, Cepko CL. Analysis of gene function in the retina. Methods Mol Biol. 2008;423:259–278. doi: 10.1007/978-1-59745-194-9_19. - DOI - PubMed
    1. Donovan SL, Dyer MA. Preparation and square wave electroporation of retinal explant cultures. Nat Protoc. 2006;1(6):2710–2718. - PubMed
    1. Baye LM, Link BA. Interkinetic nuclear migration and the selection of neurogenic cell divisions during vertebrate retinogenesis. J Neurosci. 2007;27(38):10143–10152. doi: 10.1523/JNEUROSCI.2754-07.2007. - DOI - PMC - PubMed

Publication types

LinkOut - more resources