

Novel genomic approaches unravel genetic architecture of complex traits in apple
- PMID: 23758946
- PMCID: PMC3686700
- DOI: 10.1186/1471-2164-14-393
Novel genomic approaches unravel genetic architecture of complex traits in apple
Abstract
Background: Understanding the genetic architecture of quantitative traits is important for developing genome-based crop improvement methods. Genome-wide association study (GWAS) is a powerful technique for mining novel functional variants. Using a family-based design involving 1,200 apple (Malus × domestica Borkh.) seedlings genotyped for an 8K SNP array, we report the first systematic evaluation of the relative contributions of different genomic regions to various traits related to eating quality and susceptibility to some physiological disorders. Single-SNP analyses models that accounted for population structure, or not, were compared with models fitting all markers simultaneously. The patterns of linkage disequilibrium (LD) were also investigated.
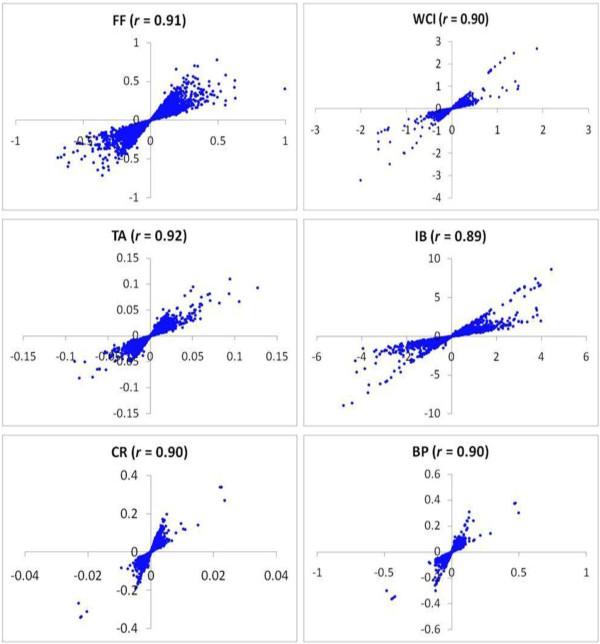
Results: A high degree of LD even at longer distances between markers was observed, and the patterns of LD decay were similar across successive generations. Genomic regions were identified, some of which coincided with known candidate genes, with significant effects on various traits. Phenotypic variation explained by the loci identified through a whole-genome scan ranged from 3% to 25% across different traits, while fitting all markers simultaneously generally provided heritability estimates close to those from pedigree-based analysis. Results from 'Q+K' and 'K' models were very similar, suggesting that the SNP-based kinship matrix captures most of the underlying population structure. Correlations between allele substitution effects obtained from single-marker and all-marker analyses were about 0.90 for all traits. Use of SNP-derived realized relationships in linear mixed models provided a better goodness-of-fit than pedigree-based expected relationships. Genomic regions with probable pleiotropic effects were supported by the corresponding higher linkage group (LG) level estimated genetic correlations.
Conclusions: The accuracy of artificial selection in plants species can be increased by using more precise marker-derived estimates of realized coefficients of relationships. All-marker analyses that indirectly account for population- and pedigree structure will be a credible alternative to single-SNP analyses in GWAS. This study revealed large differences in the genetic architecture of apple fruit traits, and the marker-trait associations identified here will help develop genome-based breeding methods for apple cultivar development.
Figures


Similar articles
-
Development and validation of a 20K single nucleotide polymorphism (SNP) whole genome genotyping array for apple (Malus × domestica Borkh).PLoS One. 2014 Oct 10;9(10):e110377. doi: 10.1371/journal.pone.0110377. eCollection 2014. PLoS One. 2014. PMID: 25303088 Free PMC article.
-
Genomic selection for fruit quality traits in apple (Malus×domestica Borkh.).PLoS One. 2012;7(5):e36674. doi: 10.1371/journal.pone.0036674. Epub 2012 May 4. PLoS One. 2012. PMID: 22574211 Free PMC article.
-
Genome-wide association studies for agronomical traits in a world wide spring barley collection.BMC Plant Biol. 2012 Jan 27;12:16. doi: 10.1186/1471-2229-12-16. BMC Plant Biol. 2012. PMID: 22284310 Free PMC article.
-
Research Progress on Genetic Basis of Fruit Quality Traits in Apple (Malus × domestica).Front Plant Sci. 2022 Jul 14;13:918202. doi: 10.3389/fpls.2022.918202. eCollection 2022. Front Plant Sci. 2022. PMID: 35909724 Free PMC article. Review.
-
Fully exploiting SNP arrays: a systematic review on the tools to extract underlying genomic structure.Brief Bioinform. 2022 Mar 10;23(2):bbac043. doi: 10.1093/bib/bbac043. Brief Bioinform. 2022. PMID: 35211719 Free PMC article.
Cited by
-
Deciphering the genetic control of fruit texture in apple by multiple family-based analysis and genome-wide association.J Exp Bot. 2017 Mar 1;68(7):1451-1466. doi: 10.1093/jxb/erx017. J Exp Bot. 2017. PMID: 28338805 Free PMC article.
-
Mapping the sensory perception of apple using descriptive sensory evaluation in a genome wide association study.PLoS One. 2017 Feb 23;12(2):e0171710. doi: 10.1371/journal.pone.0171710. eCollection 2017. PLoS One. 2017. PMID: 28231290 Free PMC article.
-
Exploiting Wild Relatives for Genomics-assisted Breeding of Perennial Crops.Front Plant Sci. 2017 Apr 4;8:460. doi: 10.3389/fpls.2017.00460. eCollection 2017. Front Plant Sci. 2017. PMID: 28421095 Free PMC article. Review.
-
Genomics-assisted breeding in fruit trees.Breed Sci. 2016 Jan;66(1):100-15. doi: 10.1270/jsbbs.66.100. Epub 2016 Jan 1. Breed Sci. 2016. PMID: 27069395 Free PMC article. Review.
-
Development and preliminary evaluation of a 90 K Axiom® SNP array for the allo-octoploid cultivated strawberry Fragaria × ananassa.BMC Genomics. 2015 Mar 7;16(1):155. doi: 10.1186/s12864-015-1310-1. BMC Genomics. 2015. PMID: 25886969 Free PMC article.
References
Publication types
MeSH terms
Substances
LinkOut - more resources
Full Text Sources
Other Literature Sources
Research Materials
