. 2013 Jun 12:12:60.
doi: 10.1186/1476-4598-12-60.

Nectin-2 is a potential target for antibody therapy of breast and ovarian cancers

Affiliations

Nectin-2 is a potential target for antibody therapy of breast and ovarian cancers

Tsutomu Oshima et al. Mol Cancer. .

Abstract

Background: Nectin-2 is a Ca(2+)-independent cell-cell adhesion molecule that is one of the plasma membrane components of adherens junctions. However, little has been reported about the involvement of Nectin-2 in cancer.

Methods: To determine the expression of Nectin-2 in cancer tissues and cancer cell lines, we performed gene expression profile analysis, immunohistochemistry studies, and flow cytometry analysis. We also investigated the potential of this molecule as a target for antibody therapeutics to treat cancers by generating and characterizing an anti-Nectin-2 rabbit polyclonal antibody (poAb) and 256 fully human anti-Nectin-2 monoclonal antibodies (mAbs). In addition, we tested anti-Nectin-2 mAbs in several in vivo tumor growth inhibition models to investigate the primary mechanisms of action of the mAbs.

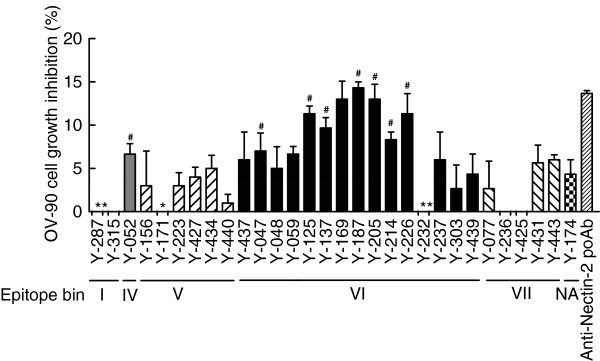
Results: In the present study, we found that Nectin-2 was over-expressed in clinical breast and ovarian cancer tissues by using gene expression profile analysis and immunohistochemistry studies. Nectin-2 was over-expressed in various cancer cell lines as well. Furthermore, the polyclonal antibody specific to Nectin-2 suppressed the in vitro proliferation of OV-90 ovarian cancer cells, which express endogenous Nectin-2 on the cell surface. The anti-Nectin-2 mAbs we generated were classified into 7 epitope bins. The anti-Nectin-2 mAbs demonstrated antibody-dependent cellular cytotoxicity (ADCC) and epitope bin-dependent features such as the inhibition of Nectin-2-Nectin-2 interaction, Nectin-2-Nectin-3 interaction, and in vitro cancer cell proliferation. A representative anti-Nectin-2 mAb in epitope bin VII, Y-443, showed anti-tumor effects against OV-90 cells and MDA-MB-231 breast cancer cells in mouse therapeutic models, and its main mechanism of action appeared to be ADCC.

Conclusions: We observed the over-expression of Nectin-2 in breast and ovarian cancers and anti-tumor activity of anti-Nectin-2 mAbs via strong ADCC. These findings suggest that Nectin-2 is a potential target for antibody therapy against breast and ovarian cancers.


Figures

Figure 1
Figure 1
Over-expression of Nectin-2 mRNA in cancer tissues. A box and whisker plot of the expression level of Nectin-2 mRNA in normal tissues and cancer tissues. The vertical axis represents Nectin-2 mRNA expression level. Nectin-2 mRNA expression in the indicated tissues was analyzed using Affymetrix U_133 arrays as described in Methods. The whiskers indicate the minimum and maximum values. The box indicates the 25th–75th percentile. N, normal tissues; C, cancer tissues. ***, p < 0.0001; **, p < 0.01; *, p < 0.05 as determined by the Mann Whitney test.
Figure 2
Figure 2
Over-expression of Nectin-2 protein in breast and ovarian cancer tissues. Paraffin-embedded tissue sections were stained with anti-Nectin-2 poAb as described in Methods. A, Normal breast tissue, BD, breast infiltrating ductal carcinoma tissues. E, normal ovarian tissue, and FH, ovarian serous carcinoma tissues.
Figure 3
Figure 3
Over-expression of Nectin-2 in cancer cell lines. Expression levels of Nectin-2 in various human cancer cell lines were examined by flow cytometry analysis using anti-Nectin-2 rabbit poAb. The vertical axis represents Nectin-2 protein expression level indicated as an MFI of FCM analysis. MFI, median fluorescent intensity.
Figure 4
Figure 4
Inhibitory activity of anti-Nectin-2 mAbs on the proliferation of OV-90 cells. OV-90 cells were cultured in the presence of 30 μg/mL anti-Nectin-2 mAbs and poAb with 1% FBS for 6 days. The percentage inhibition of cell proliferation on the vertical axis is the mean ± S.D. of triplicate assays. *; antibodies that showed negative values for cell growth inhibition. #; antibodies that showed reproducible cell growth inhibition. NA; not assigned.
Figure 5
Figure 5
Epitope binning of anti-Nectin-2 mAbs. Each column and row in the matrix represents an unlabeled and biotinylated anti-Nectin-2 mAb, respectively. The red, yellow, and white cells show a combination of antibodies that showed > 70%, > 50%, and < 50% competitive binding inhibition, respectively. The dendrogram shown on the left side of the matrix was obtained by a cluster analysis using SpotFire DecisionSite for Lead Discovery.
Figure 6
Figure 6
Inhibitory activity of anti-Nectin-2 mAb Y-187 on the proliferation of OV-90 cells. OV-90 cells were cultured in the presence of the indicated concentrations of Y-178, anti-Nectin-2 poAb, or control IgG with 1% FBS for 6 days. The percentage inhibition of cell proliferation on the vertical axis is the mean ± S.D. of triplicate assays.
Figure 7
Figure 7
Inhibitory activity of anti-Nectin-2 mAbs on Nectin-2-Nectin-2 and Nectin-2-Nectin-3 interaction. Inhibitory activity of anti-Nectin-2 mAbs on Nectin-2-Nectin-2 interaction and Nectin-2-Nectin-3 interaction were measured by using an ELISA-based time-resolved fluorescence spectroscopy assay and a Biacore assay, respectively. The percentage inhibition of Nectin-2-Nectin-2 or Nectin-2-Nectin-3 interaction on the vertical axis was calculated as described in Methods.
Figure 8
Figure 8
ADCC of anti-Nectin-2 mAbs against OV-90 cells. OV-90 cells pre-labeled with 51Cr were incubated with anti-Nectin-2 mAbs at a ratio of 1:50 with PBMC effector cells for 4 h at 37°C, followed by the measurement of 51Cr that was released into the culture supernatant. Specific cell lysis was calculated as described in Methods. The numbers in parentheses indicate the epitope bin of each antibody. The results are the mean ± S.D. of triplicate assays.
Figure 9
Figure 9
In vivo anti-tumor effect of anti-Nectin-2 mAbs in the OV-90 mouse subcutaneous xenograft preventive model. OV-90 cells were subcutaneously inoculated into the flanks of nude mice. On the same day, Y-187 or Y-443 at a dose of 15 mg/kg or vehicle was intravenously administered on a biweekly basis to the mice. The results are mean ± S.D. or tumor volume. **: p < 0.001 versus the vehicle group determined by the Steel test.
Figure 10
Figure 10
In vivo anti-tumor effect of Y-443 in the established MDA-MB-231 mouse lung metastasis model. MDA-MB-231 cells were intravenously injected into nude mice. From day 33, various doses of Y-443 or vehicle were intravenously administered on a weekly basis into the mice. The results are the mean ± S.D. at day 61. *: p < 0.025, versus vehicle group as determined by the one-tailed Shirley-Williams test.
Figure 11
Figure 11
ADCC of Y-443 and its IgG4 against MDA-MB-231 cells. MDA-MB-231 cells pre-labeled with 51Cr were incubated with Y-443 (IgG1), Y-443 IgG4, or control human IgG at a ratio of 1:50 with PBMC effector cells for 4 h at 37°C, followed by measurement of 51Cr that was released into the culture supernatant. Specific cell lysis was calculated as described in Methods. The results are the mean ± S.D. of triplicate assays.
Figure 12
Figure 12
In vivo anti-tumor effect of Y-443 IgG1 versus Y-443 IgG4 in the established MDA-MB-231 mouse subcutaneous xenograft model. MDA-MB-231 cells were injected into SCID mice, and the mice were then treated with Y-443 IgG1 (A) or Y-443 IgG4 (B) on days 36, 43, and 50 after cell injection (n = 5). The results are the mean ± S.D. *: p < 0.025 versus the control as determined by the one-tailed Williams test.
Figure 13
Figure 13
CDC of Y-443 against MDA-MB-231 cells. MDA-MB-231 cells and Daudi cells were incubated with Y-443 or rituximab together with human serum complement for 60 min at 37°C. The damaged cells were stained with propidium iodide. Antibody-specific CDC was calculated as described in Methods. The results are the mean ± S.D. of triplicate assays.

Similar articles

Cited by

References

    1. Takai Y, Nakanishi H. Nectin and afadin: novel organizers of intercellular junctions. J Cell Sci. 2003;116:17–27. doi: 10.1242/jcs.00167. - DOI - PubMed
    1. Momose Y, Honda T, Inagaki M, Shimizu K, Irie K, Nakanishi H, Takai Y. Role of the second immunoglobulin-like loop of nectin in cell-cell adhesion. Biochem Biophys Res Commun. 2002;293:45–49. doi: 10.1016/S0006-291X(02)00183-3. - DOI - PubMed
    1. Satoh-Horikawa K, Nakanishi H, Takahashi K, Miyahara M, Nishimura M, Tachibana K, Mizoguchi A, Takai Y. Nectin-3, a new member of immunoglobulin-like cell adhesion molecules that shows homophilic and heterophilic cell-cell adhesion activities. J Biol Chem. 2000;275:10291–10299. doi: 10.1074/jbc.275.14.10291. - DOI - PubMed
    1. Miyahara M, Nakanishi H, Takahashi K, Satoh-Horikawa K, Tachibana K, Takai Y. Interaction of nectin with afadin is necessary for its clustering at cell-cell contact sites but not for its cis dimerization or trans interaction. J Biol Chem. 2000;275:613–618. doi: 10.1074/jbc.275.1.613. - DOI - PubMed
    1. Yasumi M, Shimizu K, Honda T, Takeuchi M, Takai Y. Role of each immunoglobulin-like loop of nectin for its cell-cell adhesion activity. Biochem Biophys Res Commun. 2003;302:61–66. doi: 10.1016/S0006-291X(03)00106-2. - DOI - PubMed

MeSH terms