Meta-Analysis
. 2013 Jul 1;12(13):2061-72.
doi: 10.4161/cc.25134. Epub 2013 Jun 6.

A meta-analysis of the genomic and transcriptomic composition of complex life

Affiliations
Meta-Analysis

A meta-analysis of the genomic and transcriptomic composition of complex life

Ganqiang Liu et al. Cell Cycle. .

Abstract

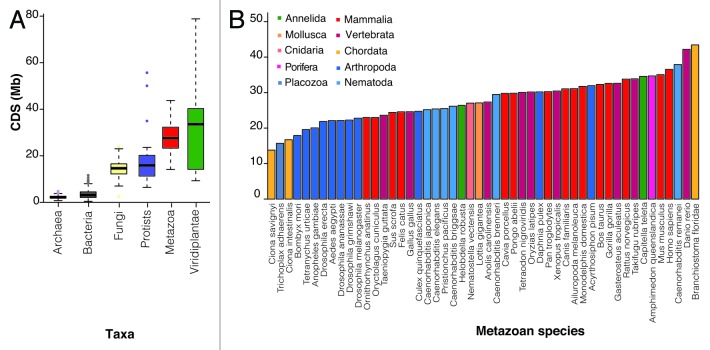
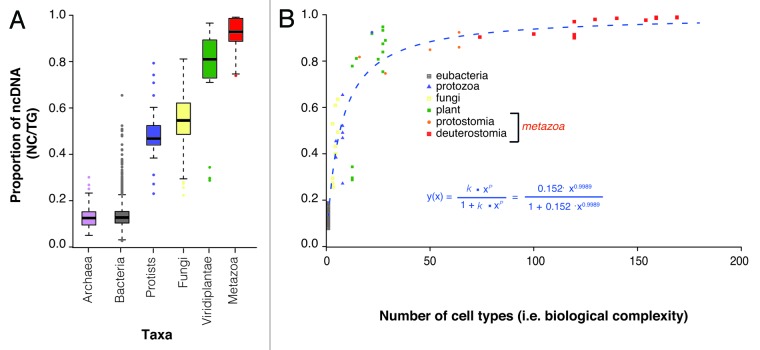
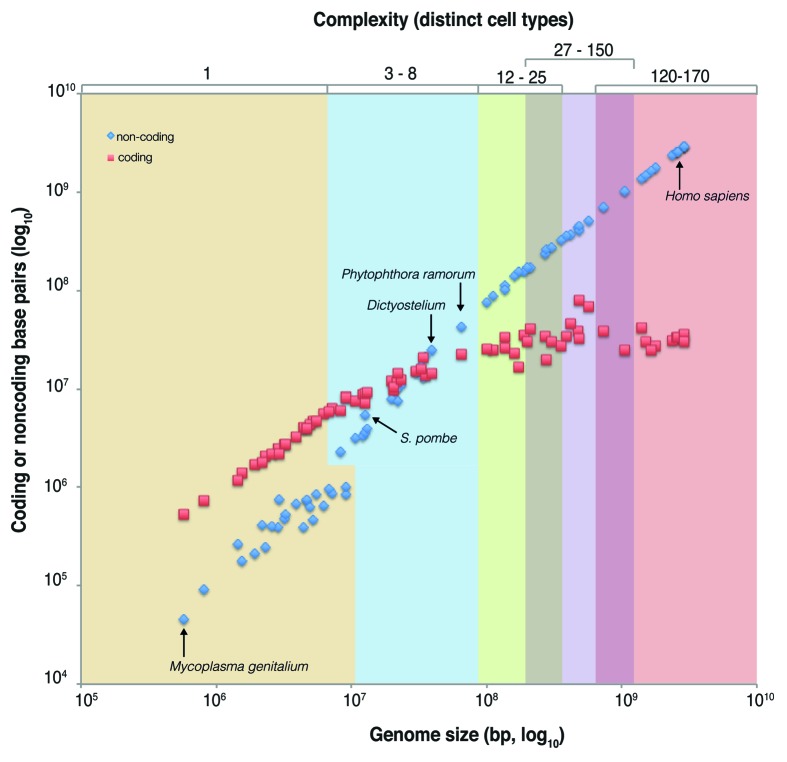
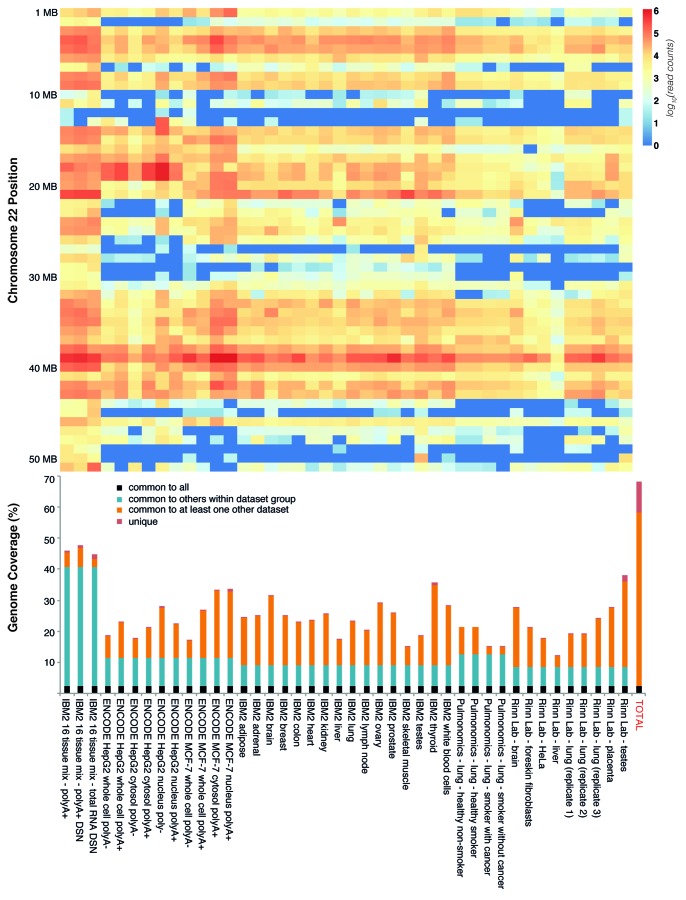
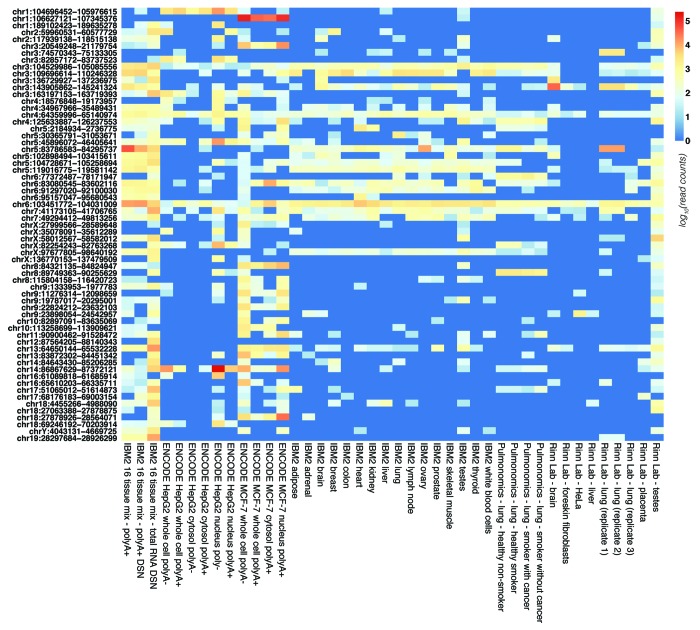
It is now clear that animal genomes are predominantly non-protein-coding, and that these sequences encode a wide array of RNA transcripts and other regulatory elements that are fundamental to the development of complex life. We have previously argued that the proportion of an animal genome that is non-protein-coding DNA (ncDNA) correlates well with its apparent biological complexity. Here we extend on that work and, using data from a total of 1,627 prokaryotic and 153 eukaryotic complete and annotated genomes, show that the proportion of ncDNA per haploid genome is significantly positively correlated with a previously published proxy of biological complexity, the number of distinct cell types. This is in contrast to the amount of the genome that encodes proteins, which we show is essentially unchanged across Metazoa. Furthermore, using a total of 179 RNA-seq data sets from nematode (47), fruit fly (72), zebrafish (20) and human (42), we show, consistent with other recent reports, that the vast majority of ncDNA in animals is transcribed. This includes more than 60 human loci previously considered "gene deserts," many of which are expressed tissue-specifically and associated with previously reported GWAS SNPs. These results suggest that ncDNA, and the ncRNAs encoded within it, may be intimately involved in the evolution, maintenance and development of complex life.

Keywords: complexity; evolution; lincRNA; non-coding DNA; noncoding RNA; small RNA.


Figures

None
Figure 1. Protein-coding sequence (CDS) across taxa and a subset of metazoan species. (A) Total protein-coding sequence (CDS) across major taxa. (B) CDS across well-annotated metazoan species. Note that among metazoan there is little divergence in the amount of total amount of genomic sequence devoted to generating protein-coding genes.
None
Figure 2. Non-protein-coding DNA content across taxa and its association with organismal complexity. (A) The proportion of non-protin-coding DNA per total haploid genome (nc/tg ratio) across taxa. (B) The nc/tg ratio values as a function of the distinct number of cell types, a proxy of biological complexity. The best fit curve, modified Hill’s equation, which itself is a logistic function, is given in blue text.
None
Figure 3. The relationship between biological complexity and genome composition. In this plot, the 73 organisms with a previously defined number of distinct cell types (e.g., relative biological complexity, see Table S1; ref. 35) are shown as pairs of data points, with one depicting total protein-coding sequence bases (red) and one total non-protein-coding bases (blue) which cumulatively give the total genome size (x-axis). Non-protein-coding sequence increases exponentially with the number of distinct cell types, while protein-coding sequence is asymptotic. Note that the intersection of the protein-coding and non-protein-coding data sets occurs among simple multicellular organisms.
None
Figure 4. Investigation of the extent of transcription in the human genome across 42 RNA-seq data sets. In the top (A) heatmap of RNA-seq expression is shown across chromosome 22 in 1 megabase bins, with the intensity displayed as a spectrum from log10(0) (blue) to log10(6) (red). The bottom panel shows total genomic coverage of each RNA-seq data set, which is derived from the tag clusters with at least 16 independent and overlapping reads plus Tophat mapped junctions with an anchor of at least 20 bases. Bar colors in the bottom panel are indicative of regions of the genome that are covered in all data sets (black, ~2.3%), those that are present in all members of a data set group (blue, i.e., the data sets were derived from the source), the proportion shared with another data set not in the data group (organge), and the proportion of genomic coverage that is unique to a particular data set (red). Note that in both the top and bottom panels the IBM2 16 tissue mixed data sets show the greatest extent and relative intensity of RNA-seq expression. Please see Supplemental Material for heatmaps of all 42 data sets across all human chromosomes.
None
Figure 5. Heatmap of transcription across gene deserts. The relative expression of each of the 63 gene deserts with at least 1,000 RNA-seq read counts (from a single library) is shown for each of the 42 human RNA-seq data sets surveyed. Read intensity is scaled in log10 from 0 (blue) to greater than 5 (red). The IBM2 16 tissue mix total RNA DSN (16-tDSN) library reveals high levels of transcription across the vast majority of gene deserts.

References

    1. McCLINTOCK B. Chromosome organization and genic expression. Cold Spring Harb Symp Quant Biol. 1951;16:13–47. doi: 10.1101/SQB.1951.016.01.004. - DOI - PubMed
    1. McCLINTOCK B. The origin and behavior of mutable loci in maize. Proc Natl Acad Sci USA. 1950;36:344–55. doi: 10.1073/pnas.36.6.344. - DOI - PMC - PubMed
    1. Britten RJ, Davidson EH. Gene regulation for higher cells: a theory. Science. 1969;165:349–57. doi: 10.1126/science.165.3891.349. - DOI - PubMed
    1. Gerstein MB, Kundaje A, Hariharan M, Landt SG, Yan KK, Cheng C, et al. Architecture of the human regulatory network derived from ENCODE data. Nature. 2012;489:91–100. doi: 10.1038/nature11245. - DOI - PMC - PubMed
    1. Neph S, Vierstra J, Stergachis AB, Reynolds AP, Haugen E, Vernot B, et al. An expansive human regulatory lexicon encoded in transcription factor footprints. Nature. 2012;489:83–90. doi: 10.1038/nature11212. - DOI - PMC - PubMed

Publication types

Substances

LinkOut - more resources