. 2013:3:1986.
doi: 10.1038/srep01986.

Antioxidant enzyme, 3-mercaptopyruvate sulfurtransferase-knockout mice exhibit increased anxiety-like behaviors: a model for human mercaptolactate-cysteine disulfiduria

Affiliations

Antioxidant enzyme, 3-mercaptopyruvate sulfurtransferase-knockout mice exhibit increased anxiety-like behaviors: a model for human mercaptolactate-cysteine disulfiduria

Noriyuki Nagahara et al. Sci Rep. 2013.

Abstract

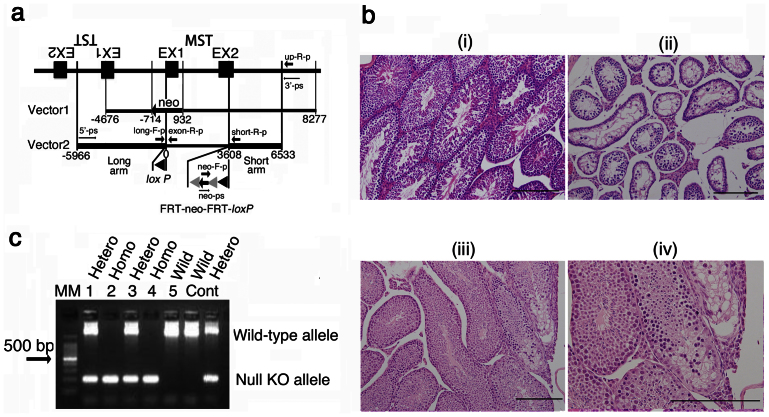
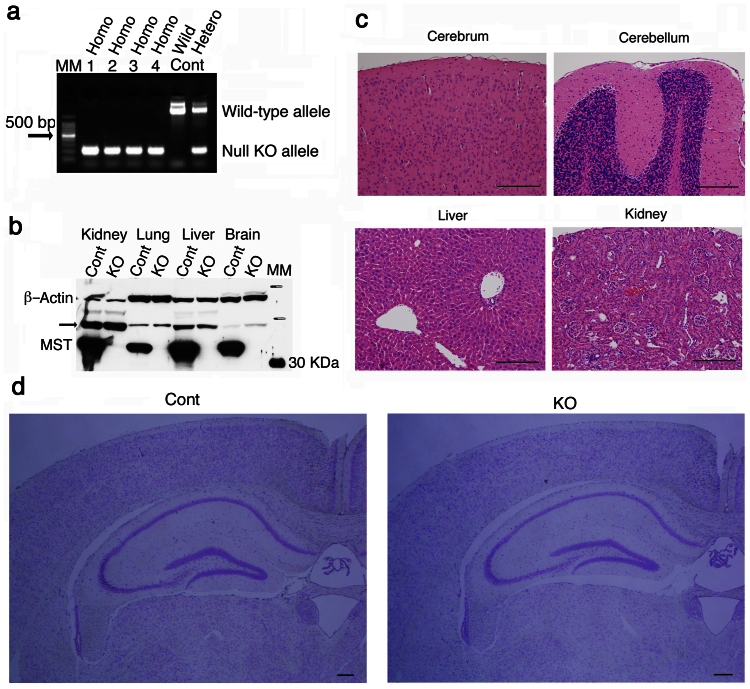
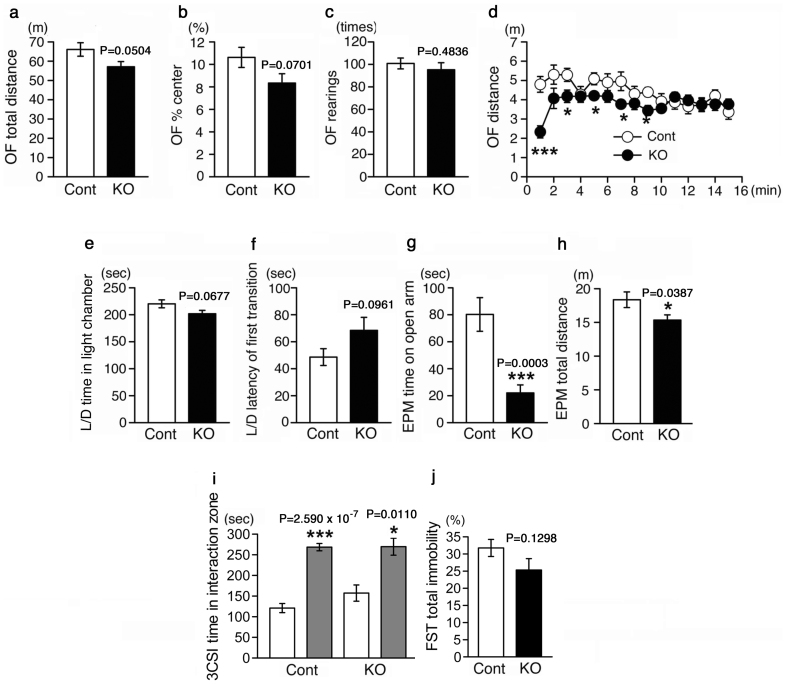
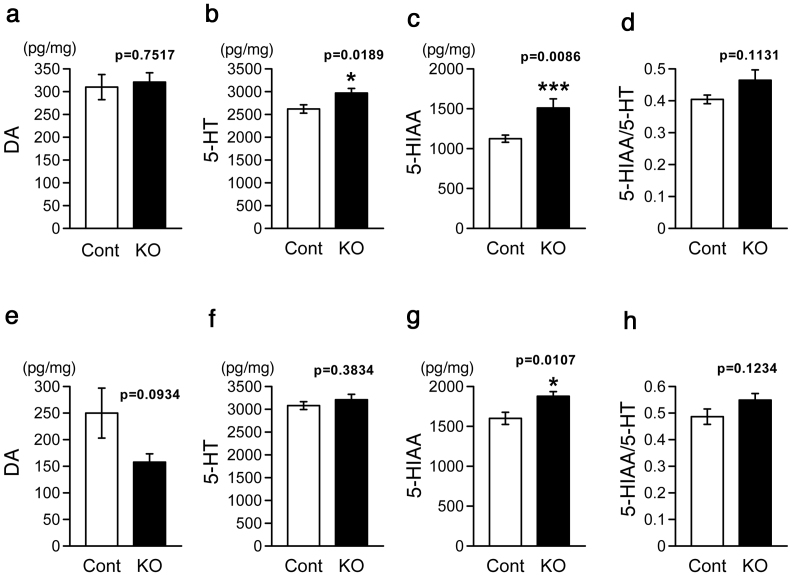
Human mercaptolactate-cysteine disulfiduria (MCDU) was first recognized and reported in 1968. Most cases of MCDU are associated with mental retardation, while the pathogenesis remains unknown. To investigate it, we generated homozygous 3-mercaptopyruvate sulfurtransferase (MST: EC 2.8.1.2) knockout (KO) mice using C57BL/6 embryonic stem cells as an animal model. The MST-KO mice showed significantly increased anxiety-like behaviors with an increase in serotonin level in the prefrontal cortex (PFC), but not with abnormal morphological changes in the brain. MCDU can be caused by loss in the functional diversity of MST; first, MST functions as an antioxidant protein. MST possessing 2 redox-sensing molecular switches maintains cellular redox homeostasis. Second, MST can produce H2S (or HS(-)). Third, MST can also produce SOx. It is concluded that behavioral abnormality in MST-KO mice is caused by MST function defects such as an antioxidant insufficiency or a new transducer, H2S (or HS(-)) and/or SOx deficiency.


Figures

Figure 1
Figure 1. MST-knockout mice production.
(a) The targeting vector, Vector 1 and Vector 2 were designed for generating a conventional and a conditional KO mouse, respectively. A loxP sequence and an FRT-neo-FRT-loxP sequence were inserted at the initiation codon, ATG and 3608 bp from the ATG, respectively in EX2. The Cre/loxP site-specific recombination system was applied. An ES cell line derived from C57BL/6 mice was used. neo, neomycin resistance gene; exon-R-p, a reverse probe on the EX1 for PCR genotyping; long-F-p, a forward probe on the long arm for PCR genotyping; neo-F-p, a forward probe on the neo for PCR genotyping; Up-R-p, a reverse probe on the upstream of the short arm for PCR genotyping; short-R-p, a reverse probe on the short arm for PCR genotyping; 3′-ps, a forward probe on the long arm for Southern analysis; 5′-ps, a reverse probe on the upstream of the short arm for Southern analysis; neo′-ps, a forward probe on the neo for Southern analysis. (b) Pathologic findings (HE staining) of the testis of a heterozygous KO (Cre+) mouse. (i), normal testis (a wild-type); (ii) and (iii) abnormal testis (mouse ID#44-T-3-2 and #44-3-11-6-T-1, respectively); (iv), a magnified view of (iii). Bars, 200 μm. (c) PCR genotyping of offspring produced from mating between heterozygous KO (Cre−). Genomic DNA was obtained from #44-T-7-3-4-1 (male heterozygous), #44-T-7-3-4-2 (male homozygous), #44-T-7-3-4-3 (female heterozygous), #44-T-7-3-4-4 (female homozygous), and #44-T-7-3-4-5 (female wild-type) (lanes 1 to 5, in the above order). MM, 100-bp DNA ladder molecular marker; Cont, control genome; Hetero, heterozygous KO mouse; Wild, wild-type mouse.
Figure 2
Figure 2. Homozygous (null) MST-knockout mice.
(a) PCR genotyping of offspring produced from mating between MST-KO mice. Genomic DNA was obtained from #44-T-7-3-4-2-8 to 11 (male homozygous) (lanes 1 to 4 in the above order). (b) Western blot analysis for a MST-KO mouse (#44-T-3-2) with overreaction. MM, molecular marker; arrow, rhodanese (the MST antibody slightly cross-reacted with rhodanese); Cont, control mice; KO, MST-KO mice. (c) Microscopic examination (HE staining) of a MST-KO (#44-T-3-2). Bars, 200 μm. (d) Nissl staining for coronal sections of the hippocampal areas of wild-type and the mutant adult brains (#44-H-3-2-1 to 3 and #44-H-3-3-9 to 12). Cont, control mice; KO, MST-KO mice. Bars, 200 μm.
Figure 3
Figure 3. Behavioral tests.
MST-KO mice (#44-H-1-6, 44-H-1-7, 44-H-1-8, 44-H-2-3, 44-H-2-4, 44-H-2-5, 44-H-2-11, 44-H-2-12, 44-H-2-13, 44-H-3-3-1, 44-H-3-3-2, 44-H-3-3-3, 44-H-3-7, 44-H-3-8, 44-H-3-9, 44-H-3-13, and 44-H-3-14 obtained from 6 different parents) showed anxiety-like behaviors (a–h). (a–d) Open field test (OF) (in Fig. 3d, p values of data from 1 to 15 min between MST-KO and control groups are 3.851 × 10⁻⁵, 0.1001, 0.0240, 0.8534, 0.0290, 0.1822, 0.0373, 0.3342, 0.0113, 0.4355, 0.500, 0.5284, 0.9876, 0.3265, and 0.3905, respectively). (e, f) Light/Dark transition test (L/D). (g, h) Elevated plus-maze test (EPM). (i) 3-chambered social interaction tests (3CSI) to examine social behavior. The values of white bars represent the interaction time with empty cage. The values of gray bars represent the interaction time with the cage in which a stranger mouse resides. (j) Forced swim tests (FST) for depressiveness. All data represent the mean ± S.E.M (bar). *, p < 0.05; ***, p < 0.001; Cont, control mice; KO, homozygous (null) KO mice.
Figure 4
Figure 4. Monoamines analyses.
Regional brain monoamines in MST-KO mice (#44-H-2-6-1, 44-H-2-17-1 to 2, 44-H-3-10-1 to 2, and 44-H-3-11-1 to 5 obtained from 4 different parents) were assayed. (a–d) Prefrontal cortex. (e–g) Hippocampus. Monoamine contents were expressed in pg monoamine per mg tissue protein. All data represent the mean ± S.E.M (bar). *, p < 0.05; ***, p < 0.001; Cont, control mice; KO, homozygous (null) KO mice.
Figure 5
Figure 5. Quantitative analyses of 5HT1A receptor mRNA.
Regional brain 5HT1A receptor mRNA in MST-KO mice (for the PFC and hippocampus were from #44-H-2-6-1, 44-H-2-17-1 to 2, 44-H-3-10-1 to 2, and 44-H-3-11-1 to 5 obtained from 4 different parents; for DRN were from #44-H-3-10-4-1 to 3, and 44-H-2-17-3-1 to 7 obtained from 2 different parents) were assayed. (a) PFC. (b) Hippocampus. (c) DRN. Amount of 5HT1A receptor mRNA were expressed in copies per μg tissue total RNA. All data represent the mean ± S.E.M (bar). Cont, control mice; KO, homozygous (null) KO mice.

References

    1. Jarabak R. 3-Mercaptopyruvate sulfurtransferase. Methods Enzymol. 77, 291–297 (1981). - PubMed
    1. Nagahara N., Ito T., Kitamura H. & Nishino T. Tissue and subcellular distribution of mercaptopyruvate sulfurtransferase in the rat: confocal laser fluorescence and immunoelectron microscopic studies combined with biochemical analysis. Histochem. Cell Biol. 110, 243–250 (1998). - PubMed
    1. Nagahara N. & Katayama A. Post-translational regulation of mercaptopyruvate sulfurtransferase via a low redox potential cysteine-sulfenate in the maintenance of redox homeostasis. J. Biol. Chem. 280, 34569–34576 (2005). - PubMed
    1. Nagahara N. Regulation of Mercaptopyruvate sulfurtransferase activity via intrasubunit and intersubunit redox-sensing switches. Antioxid. Redox Signal. (2013) in press (2012 Dec 19. [Epub ahead of print]). - PubMed
    1. Nagahara N., Yoshii T., Abe Y. & Matsumura T. Thioredoxin-dependent enzymatic activation of mercaptopyruvate sulfurtransferase. An intersubunit disulfide bond serves as a redox switch for activation. J. Biol. Chem. 282, 1561–1569 (2007). - PubMed

Publication types

MeSH terms

Substances

Supplementary concepts