. 2013 Aug;87(16):9173-88.
doi: 10.1128/JVI.01216-13. Epub 2013 Jun 12.

Merkel cell polyomavirus large T antigen disrupts host genomic integrity and inhibits cellular proliferation

Affiliations

Merkel cell polyomavirus large T antigen disrupts host genomic integrity and inhibits cellular proliferation

Jing Li et al. J Virol. 2013 Aug.

Abstract

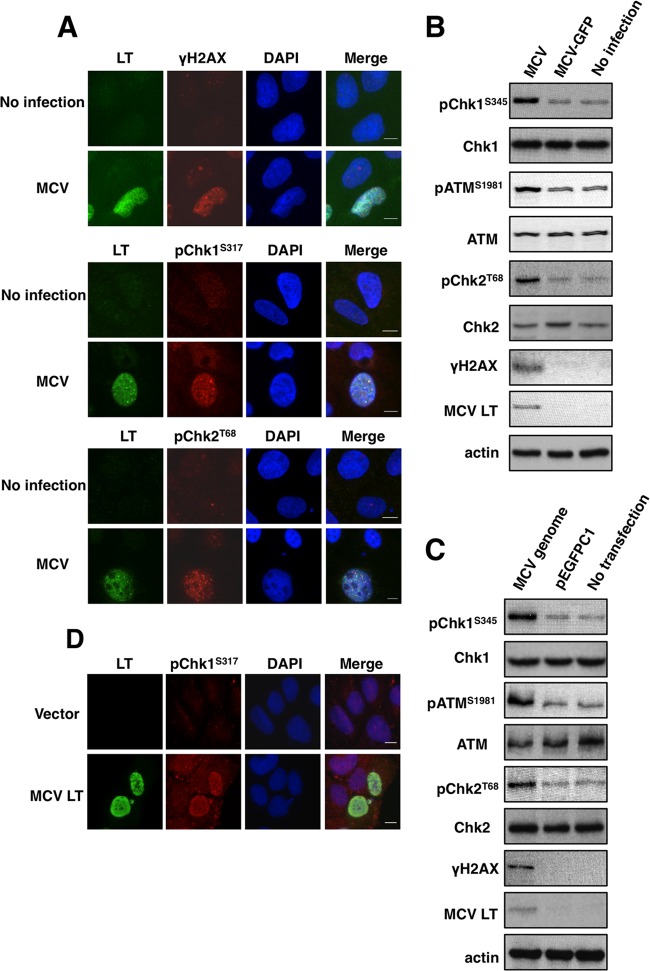
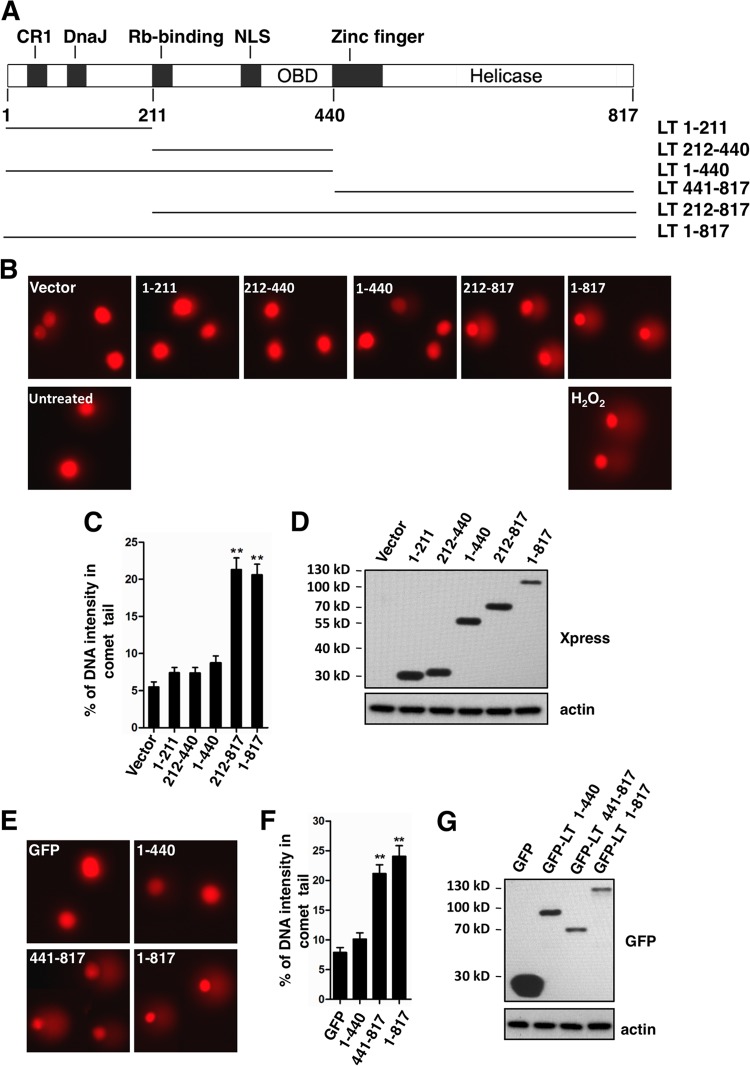
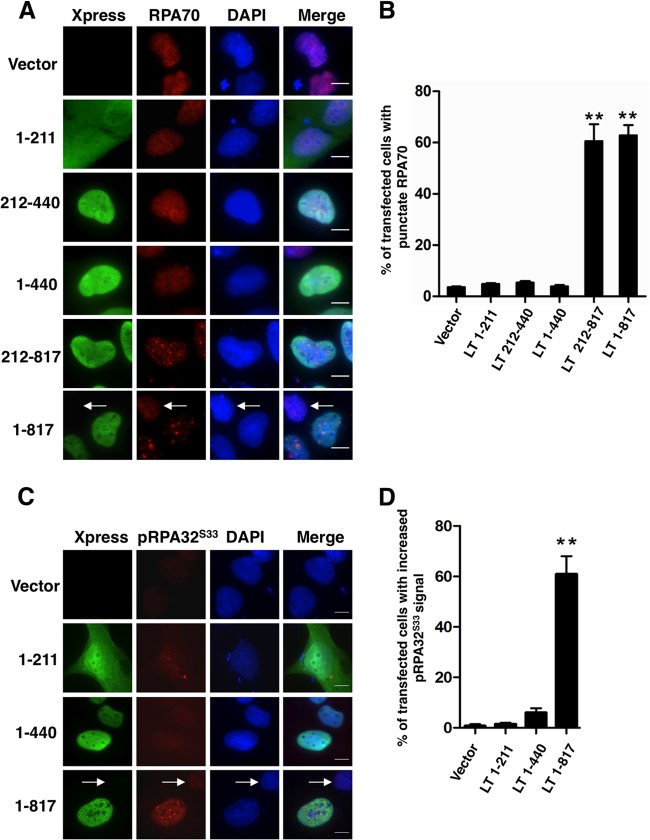
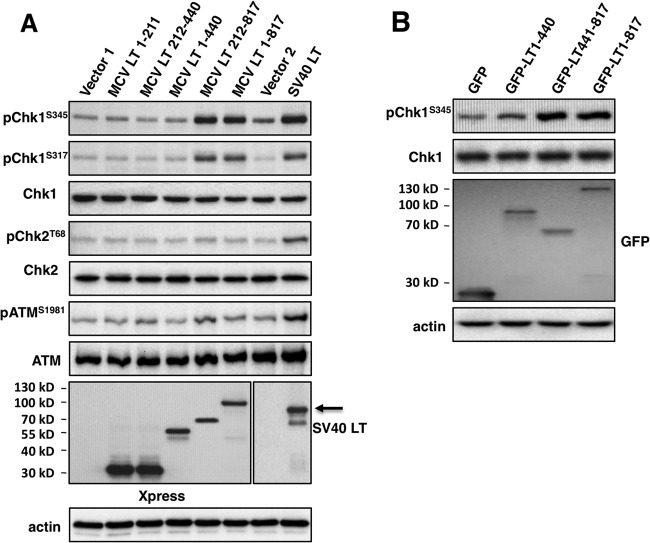
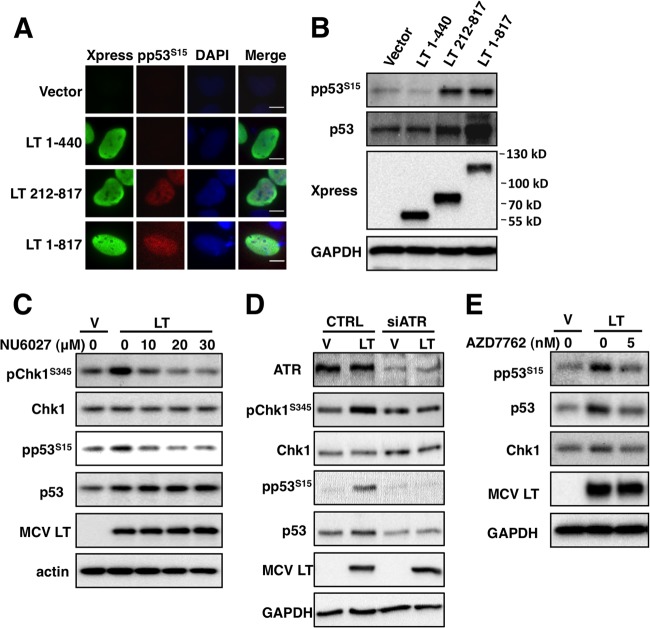
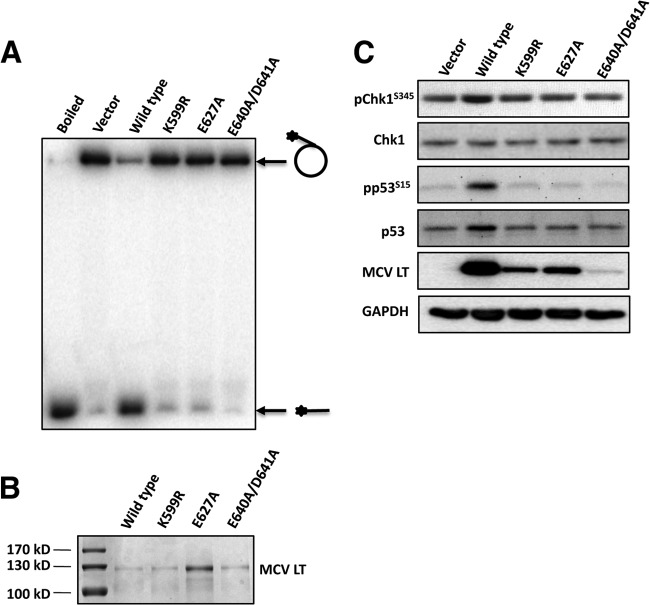
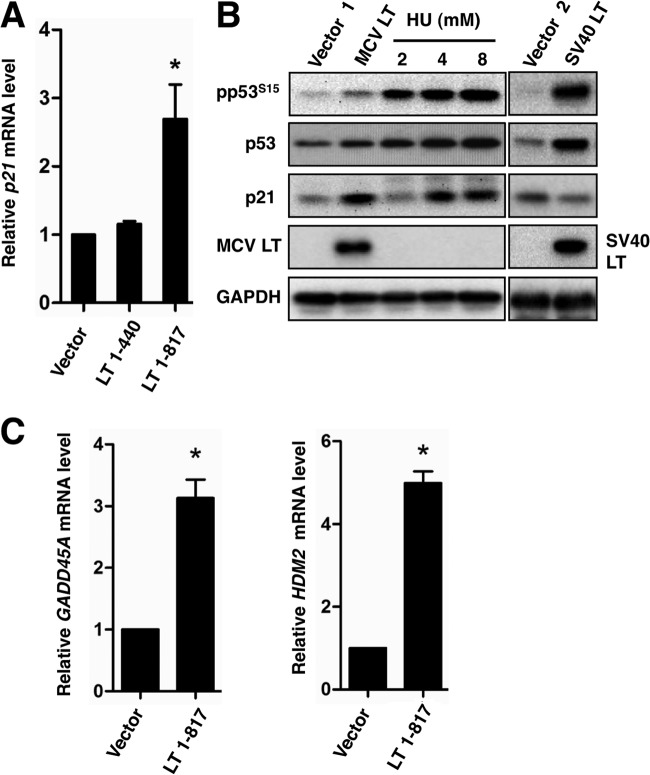
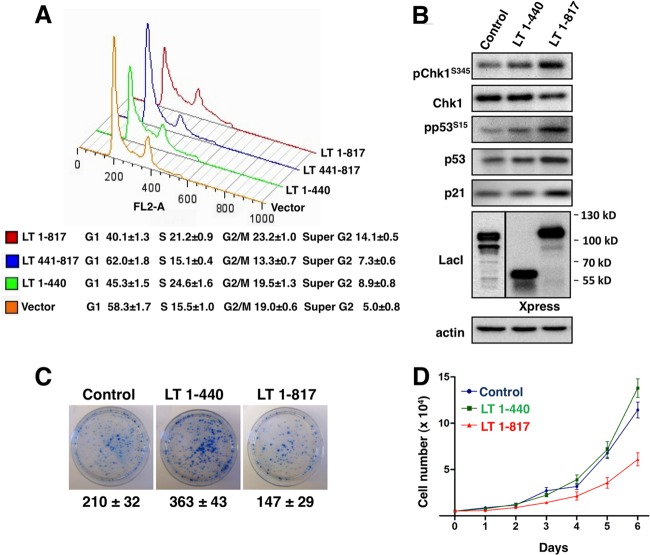
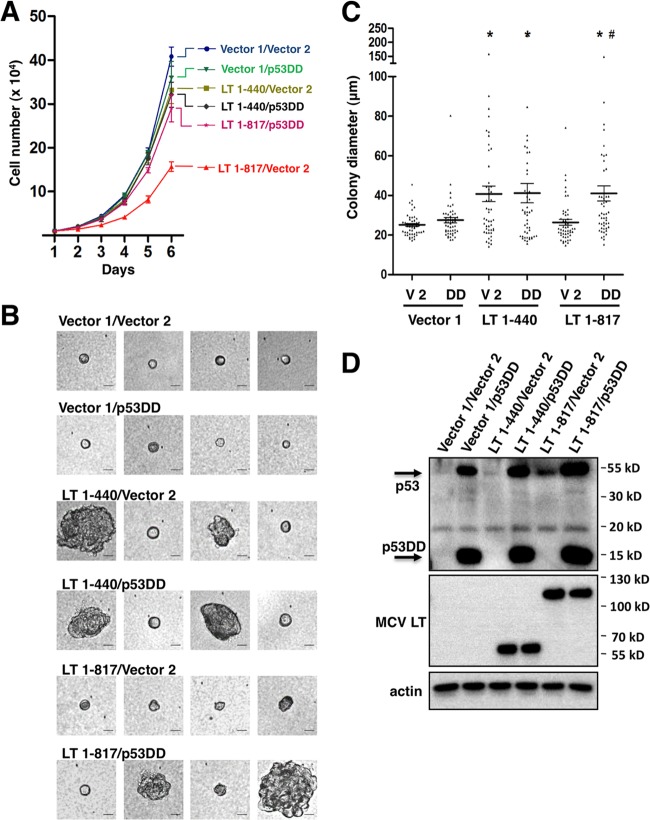
Clonal integration of Merkel cell polyomavirus (MCV) DNA into the host genome has been observed in at least 80% of Merkel cell carcinoma (MCC). The integrated viral genome typically carries mutations that truncate the C-terminal DNA binding and helicase domains of the MCV large T antigen (LT), suggesting a selective pressure to remove this MCV LT region during tumor development. In this study, we show that MCV infection leads to the activation of host DNA damage responses (DDR). This activity was mapped to the C-terminal helicase-containing region of the MCV LT. The MCV LT-activated DNA damage kinases, in turn, led to enhanced p53 phosphorylation, upregulation of p53 downstream target genes, and cell cycle arrest. Compared to the N-terminal MCV LT fragment that is usually preserved in mutants isolated from MCC tumors, full-length MCV LT shows a decreased potential to support cellular proliferation, focus formation, and anchorage-independent cell growth. These apparently antitumorigenic effects can be reversed by a dominant-negative p53 inhibitor. Our results demonstrate that MCV LT-induced DDR activates p53 pathway, leading to the inhibition of cellular proliferation. This study reveals a key difference between MCV LT and simian vacuolating virus 40 LT, which activates a DDR but inhibits p53 function. This study also explains, in part, why truncation mutations that remove the MCV LT C-terminal region are necessary for the oncogenic progression of MCV-associated cancers.


Figures

Fig 1
Fig 1
Both MCV infection and MCV genome transfection induce a DNA damage response. (A) U2OS cells transduced with native MCV virions (MCV) and no-infection control cells were harvested at 5 days postinfection and stained with antibodies for MCV LT (green) and DDR markers (red) as indicated. Cells were counterstained with DAPI. Bar, 10 μm. (B) U2OS cells transduced with native MCV virions (MCV) or MCV-GFP pseudovirions (MCV-GFP) and no-infection control cells were harvested at 5 days postinfection and immunoblotted with the indicated antibodies. (C) U2OS cells were transfected with religated MCV genome or pEGFPC1. At 48 h posttransfection, cells were harvested and immunoblotted with the indicated antibodies. (D) U2OS cells were transfected with pcDNA4C (Vector) or pcDNA4C-full-length MCV LT (MCV LT). The cells were fixed at 36 h posttransfection and stained with MCV LT (green) and pChk1S317 (red) antibodies. Cells were counterstained with DAPI. Bar, 10 μm.
Fig 2
Fig 2
MCV LT induces DNA damage in host genome. (A) Schematic diagram of the MCV LT protein and truncation mutants used in the present study. CR1, conserved region 1; DnaJ, Hsc70-binding conserved region; NLS, nuclear localization signal; OBD, origin-binding domain. (B) U2OS cells were transfected with pcDNA4C (Vector) or pcDNA4C encoding the indicated LT molecules. Cells were harvested at 36 h posttransfection and analyzed using a comet assay. For positive and negative controls, cells were treated with 100 μM H2O2 and PBS, respectively. Representative images of comets from three independent experiments are shown. (C) The percentage of DNA intensity in the comet tail was quantified from 100 randomly selected comet images for each transfection. Error bars represent mean ± the standard error of the mean (SEM) calculated from each transfection. Asterisks indicate significant difference (P < 0.01) compared to cells transfected with vector. (D) Expression of LT molecules in U2OS cells was detected by Western blotting with the indicated antibodies. (E) U2OS cells were transfected with pEGFPC1 (GFP) or pEGFPC1 encoding the indicated LT molecules. Cells were harvested at 36 h posttransfection and analyzed using the comet assay. Representative images of comets are shown. (F) The percentage of DNA intensity in the comet tail was quantified and presented as in panel C. (G) Expression of GFP-tagged LT molecules was detected by Western blotting with the indicated antibodies.
Fig 3
Fig 3
RPA70 and pRPA32S33 accumulate in punctate nuclear foci in LT- expressing cells. (A) U2OS cells were transfected with pcDNA4C (Vector) or pcDNA4C encoding the indicated LT molecules fused to an Xpress tag. At 36 h posttransfection, cells were stained with Xpress (green) and RPA70 (red) antibodies. The cells were counterstained with DAPI. An arrow marks a nontransfected cell. Bar, 10 μm. (B) The percentage of cells showing RPA70 accumulation was quantified from ∼100 positively transfected cells. For cells transfected with the vector, the percentage of cells showing RPA70 accumulation was quantified from ∼100 total cells. The mean ± the standard deviation (SD) was calculated from three independent experiments. Asterisks indicate significant difference (P < 0.01) compared to vector-transfected cells. (C) U2OS cells were transfected and stained as in panel A using Xpress (green) and pRPA32S33 (red) antibodies. (D) The percentage of cells showing increased pRPA32S33 signal was quantified as in panel B.
Fig 4
Fig 4
The MCV LT C-terminal domain induces a DNA damage response. (A) U2OS cells were transfected with pcDNA4C (Vector 1), pcDNA4C encoding Xpress-tagged MCV LT molecules as indicated, pIRES-Hygromycin (Vector 2, control for pTIH) or pTIH encoding SV40 LT. At 36 h posttransfection, cells were lysed and immunoblotted with the indicated antibodies. (B) U2OS cells were transfected with pEGFPC1 or pEGFPC1 encoding MCV LT molecules as indicated. At 36 h posttransfection, cells were immunoblotted with the indicated antibodies. All experiments were repeated more than three times with consistent results.
Fig 5
Fig 5
MCV LT induces p53S15 phosphorylation through ATR/Chk1 pathway. (A) U2OS cells transfected with pcDNA4C (Vector) or pcDNA4C encoding the indicated Xpress-tagged MCV LT molecules were stained with Xpress (green) and pp53S15 (red) antibodies at 36 h posttransfection. The cells were counterstained with DAPI. Bar, 10 μm. (B) U2OS cells were transfected as in panel A. At 36 h posttransfection, cells were lysed and immunoblotted with the indicated antibodies. (C) U2OS cells transfected with pcDNA4C (Vec) or pcDNA4C-LT1-817 were treated with dimethyl sulfoxide (DMSO) or 10, 20, or 30 μM NU6027 for 24 h. Cells were lysed and immunoblotted with the indicated antibodies. (D) U2OS cells were transfected with control (CTRL) or ATR siRNA. At 36 h posttransfection, cells were transfected with pcDNA4C (V) or pcDNA4C-LT1-817 (LT). Cells were lysed and immunoblotted at 72 h after siRNA transfection with the indicated antibodies. (E) U2OS cells transfected with pcDNA4C (Vec) or pcDNA4C-LT1-817 (MCV LT) were treated with DMSO or 5 nM AZD7762 for 24 h. Cells were lysed and immunoblotted with the indicated antibodies. All experiments were repeated three times with consistent results.
Fig 6
Fig 6
Examination of the MCV LT helicase activity in DDR activation. (A) Helicase assay of wild-type and mutant MCV LT. Wild-type MCV LT or LT point mutants were expressed in 293 cells. Immunopurified recombinant proteins were used in the helicase assay. The circle with an asterisk indicates radiolabeled single-stranded DNA (ssDNA) annealed to nonradiolabeled M13 ssDNA. The horizontal line with an asterisk indicates unwound radiolabeled ssDNA. The substrate was also boiled to show the unwound ssDNA. (B) SDS-PAGE and Coomassie brilliant blue staining of purified MCV LT proteins. (C) U2OS cells were transfected with pcDNA4C (Vector), wild-type MCV LT (wild type), or one of the MCV LT mutants. At 36 h posttransfection, the cells were lysed and immunoblotted with the indicated antibodies.
Fig 7
Fig 7
MCV LT induces expression of p53 downstream targets. (A) U2OS cells were transfected with pcDNA4C (Vector) or pcDNA4C encoding the indicated LT molecules. Total RNA was extracted at 48 h posttransfection and analyzed for p21 expression using RT-qPCR. The p21 mRNA levels were normalized to GAPDH mRNA levels and presented as the ratio of transcript in MCV LT-expressing samples relative to the vector control. Values represent the average of three independent experiments with error bars indicating the standard deviation. Asterisk indicates significant difference (P < 0.05) from vector transfected cells. (B) U2OS cells were transfected with pcDNA4C (Vector 1), pcDNA4C encoding Xpress-tagged MCV LT, pIRES-Hygromycin (Vector 2, control for pTIH), or pTIH encoding SV40 LT. Untransfected cells treated with 2, 4, or 8 mM hydroxyurea (HU) for 12 h serve as positive controls. Cells were harvested and immunoblotted at 48 h posttransfection using the antibodies indicated. This experiment was repeated three times with consistent results. (C) U2OS cells were transfected with pcDNA4C (Vector) or pcDNA4C-MCVLT1-817. Total RNA was extracted at 48 h posttransfection to detect p53 downstream target GADD45A and HDM2 transcription levels using RT-qPCR. Values represent the average of three independent experiments with error bars indicating the standard deviation. Asterisk indicates significant difference (P < 0.05) from the vector control.
Fig 8
Fig 8
MCV LT arrests the cell cycle and inhibits cellular proliferation. (A) U2OS cells were transfected with pEGFPC1 or pEGFPC1 encoding the indicated LT molecules. At 48 h posttransfection, cells were fixed and stained with propidium iodide (PI). The DNA content in GFP-positive cells was analyzed by flow cytometry using a BD FACSCalibur. The data were analyzed using FlowJo. (B) U2OS cells stably expressing MCV LT 1-440, MCV LT 1-817, or Cherry-LacI (Control) were analyzed by Western blotting with the indicated antibodies. (C) U2OS stable cells were seeded at 5 × 10³ cells/dish in 6-cm dishes and cultured in medium containing puromycin for 10 days. Colonies were stained with methylene blue. Colony numbers and means ± the standard deviations were calculated from three independent experiments. (D) U2OS stable cells were seeded at 5 × 10³ cells/well in six-well plates and cultured in medium containing 2 μg of puromycin/ml. Cell numbers were counted on days 1 to 6 after seeding. This experiment was repeated three times with consistent results.
Fig 9
Fig 9
Inhibition of cellular proliferation by the MCV LT C-terminal domain can be rescued by a dominant-negative p53 inhibitor. (A) NIH 3T3 cells stably expressing either one of the MCV LT molecules or vector pLPCX (Vector 1), together with p53DD or vector pLXSN (Vector 2), were seeded at 104 cells/6-cm dish and cultured in medium containing 2 μg of puromycin/ml and 0.4 mg of G418/ml. Cell numbers were counted at day 1 to 6 after seeding. This experiment was repeated three times with consistent results. (B) NIH 3T3 double-stable cells were analyzed in the soft agar colony formation assay. Representative images of colonies are shown. Bar, 25 μm. (C) The colony diameter was quantified from 50 randomly selected colonies for each cell line. Error bars represent means ± the standard errors of the mean calculated from three independent experiments. An asterisk (*) indicates significant a difference (P < 0.05) compared to vector 1/vector 2 control. #, Significant difference (P < 0.05) compared to LT-817/Vector 2. (D) Expression of MCV LT molecules and p53DD in NIH 3T3 double-stable cells was detected using Western blotting.

References

    1. Gjoerup O, Chang Y. 2010. Update on human polyomaviruses and cancer. Adv. Cancer Res. 106:1–51 - PubMed
    1. Feng H, Shuda M, Chang Y, Moore PS. 2008. Clonal integration of a polyomavirus in human Merkel cell carcinoma. Science 319:1096–1100 - PMC - PubMed
    1. Kassem A, Schöpflin A, Diaz C, Weyers W, Stickeler E, Werner M, Zur Hausen A. 2008. Frequent detection of Merkel cell polyomavirus in human Merkel cell carcinomas and identification of a unique deletion in the VP1 gene. Cancer Res. 68:5009–5013 - PubMed
    1. Rodig SJ, Cheng J, Wardzala J, DoRosario A, Scanlon JJ, Laga AC, Martinez-Fernandez A, Barletta JA, Bellizzi AM, Sadasivam S, Holloway DT, Cooper DJ, Kupper TS, Wang LC, DeCaprio JA. 2012. Improved detection suggests all Merkel cell carcinomas harbor Merkel polyomavirus. J. Clin. Invest. 122:4645–4653 - PMC - PubMed
    1. Hashida Y, Imajoh M, Nemoto Y, Kamioka M, Taniguchi A, Taguchi T, Kume M, Orihashi K, Daibata M. 2013. Detection of Merkel cell polyomavirus with a tumour-specific signature in non-small cell lung cancer. Br. J. Cancer 108:629–637 - PMC - PubMed

Publication types