. 2013 Jun 12;10(85):20130212.
doi: 10.1098/rsif.2013.0212. Print 2013 Aug 6.

Scaling down DNA circuits with competitive neural networks

Affiliations

Scaling down DNA circuits with competitive neural networks

Anthony J Genot et al. J R Soc Interface. .

Abstract

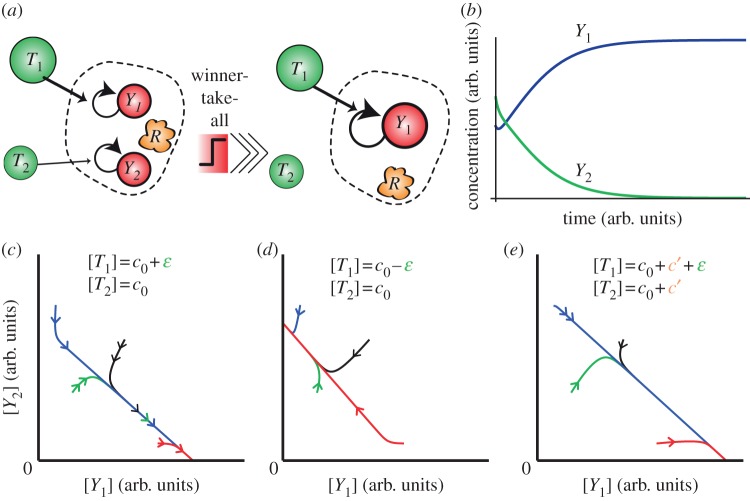
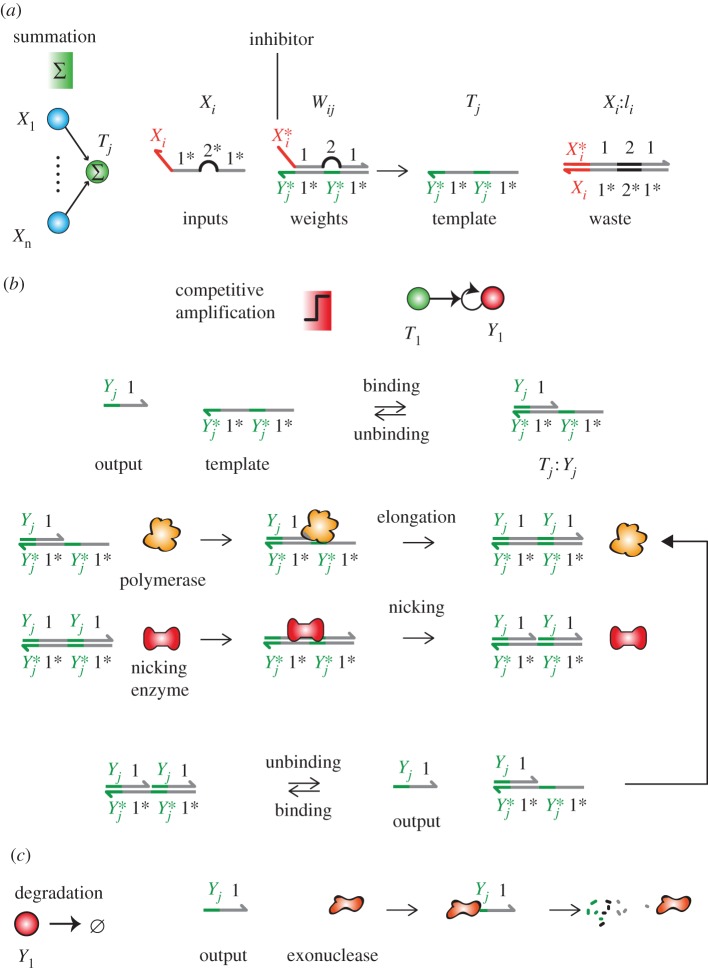
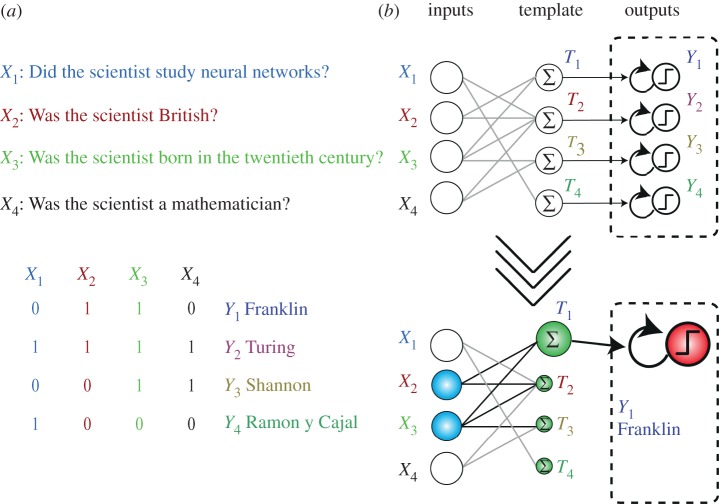
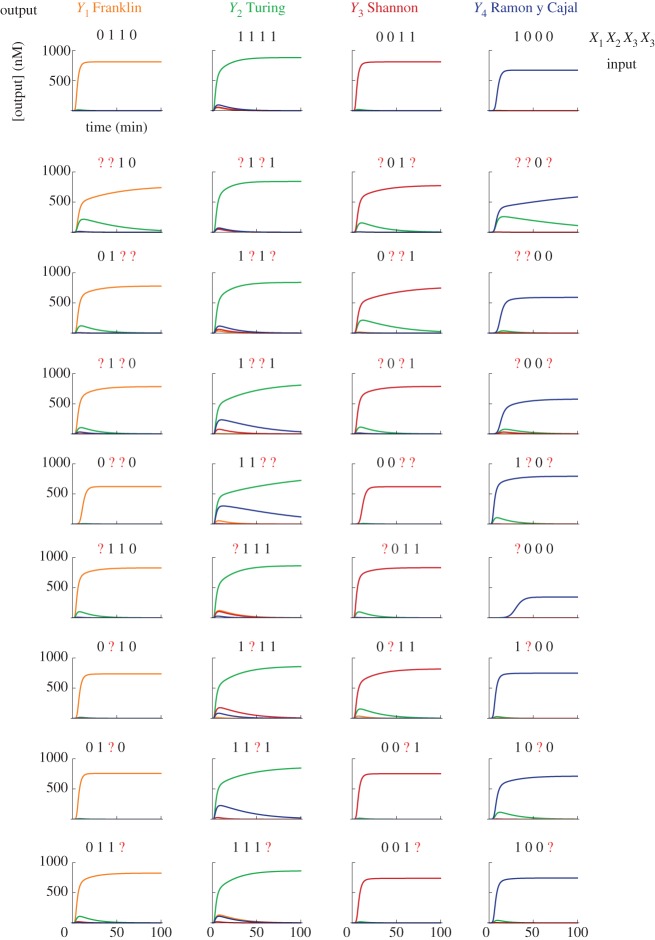
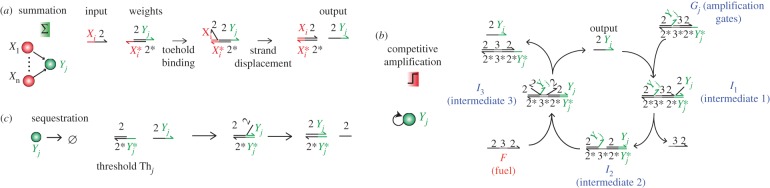
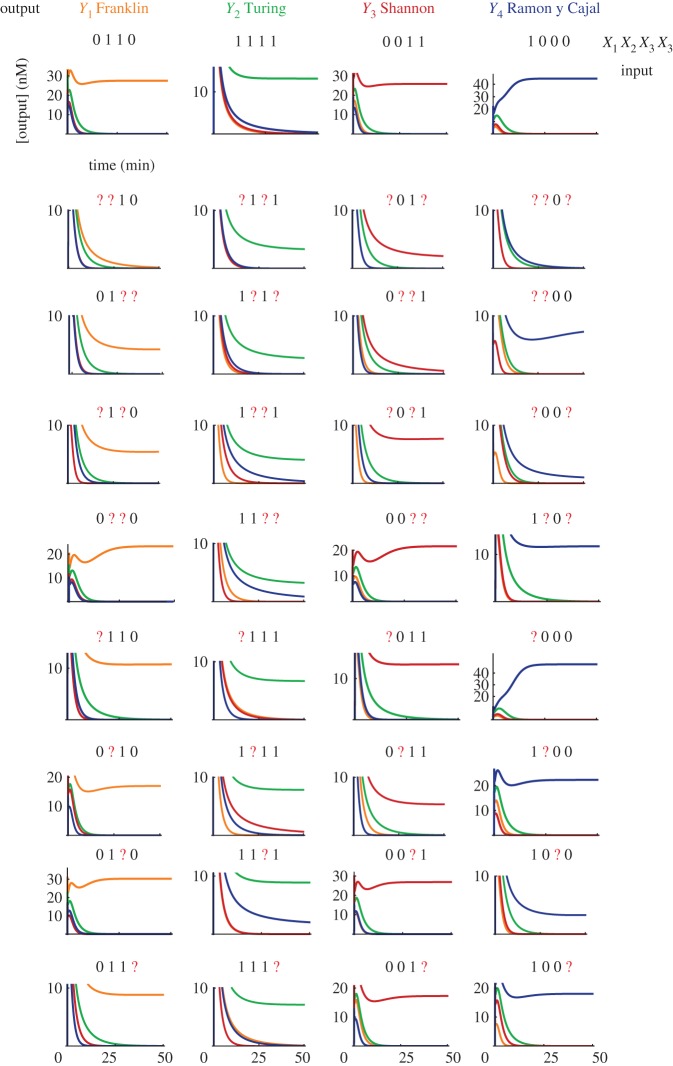
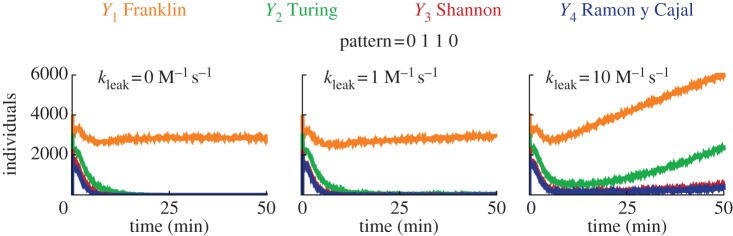
DNA has proved to be an exquisite substrate to compute at the molecular scale. However, nonlinear computations (such as amplification, comparison or restoration of signals) remain costly in term of strands and are prone to leak. Kim et al. showed how competition for an enzymatic resource could be exploited in hybrid DNA/enzyme circuits to compute a powerful nonlinear primitive: the winner-take-all (WTA) effect. Here, we first show theoretically how the nonlinearity of the WTA effect allows the robust and compact classification of four patterns with only 16 strands and three enzymes. We then generalize this WTA effect to DNA-only circuits and demonstrate similar classification capabilities with only 23 strands.

Keywords: molecular programming; pattern recognition; strand displacement circuits; winner-take-all.


Figures

Figure 1.
Figure 1.
WTA in enzymatic systems. (a) Several outputs Yj replicate, thanks to a specific template Tj and a common and limited enzymatic resource R. They are continuously degraded by a mechanism not shown here. The competition for the resource R leads a WTA effect. The output with the highest concentration of template evicts the others because it provides the fastest replication rate for its output (assuming all other chemical parameters are equal). (b) Schematic time-plot showing the WTA effect. Although there is initially more Y2 than Y1, the latter eventually evicts the former as [T1] > [T2]. (c) Phase plot in the space of concentrations for several trajectories with different initial conditions. The template T1 is in slight excess compared with T2. The winner, Y1, does not depend on the initial concentration of outputs, provided they are all initially present. (d) The output Y2 wins for the same initial conditions as (c), but with an excess of T2 over T1. (e) The behaviour is unchanged by a shift of all templates concentrations by a constant concentration c′.
Figure 2.
Figure 2.
Chemical operation of hybrid DNA/enzyme circuits. By a slight abuse of notation, Xi refers either to the output Xi or its specific domain. The number-labelled domains are global, shared by all outputs. The letter-labelled domains are specific to an input or output. (a) Strand displacement performs pseudo-weighted-sums of the inputs concentrations. An input Xi displaces an inhibitor Ii from a weight complex Wij = Ii : Tj to give an active template Tj. (b) Amplification. A template Tj catalyses the replication of Yj through a mechanism mediated by a polymerase and a nicking enzyme. Binding of the output Yj to the template triggers its elongation by the polymerase and nicking by a nicking enzyme. Spontaneous melting releases the outputs. (c) Degradation. Outputs are continuously degraded by an exonuclease enzyme which hydrolyses single-stranded DNA.
Figure 3.
Figure 3.
General structure of the classification circuit. The circuit takes as input four questions about a scientist and returns an output strand that corresponds to the scientist. (a) Questions associated with the scientists. (b) Organization of the circuit. Inputs Xi lead to the production of templates Tj, which in turn catalyse the competitive amplification of outputs Yj in a WTA layer.
Figure 4.
Figure 4.
Simulation of pattern classification with the hybrid DNA/enzyme circuit. The plots show the temporal evolution of free outputs Yj in response to the injection of the four correct patterns and 32 corrupted versions of those. Injected patterns are indicated on top of each plot. A question mark (?) indicates a corrupted input, whose concentration is 0.5 c0 rather than 0 or c0. Patterns are injected at t = 0. We set a constant level of undegradable outputs at ε = 10 pM, which serves to initiate amplification.
Figure 5.
Figure 5.
Pattern recognition with DNA-only circuits. (a) Summation. The concentrations of inputs are summed by translation gates. (b) Competitive amplification. Outputs are amplified by a mechanism based on toehold exchange. During amplification, outputs compete for a limited and global fuel. (c) Sequestration. Outputs Yj are also irreversibly sequestered by threshold gates Thj. When there is just enough fuel to saturate one but not all thresholds, amplification becomes competitive. It is expected that the output (or outputs) with the highest initial concentration (or concentrations) survive(s).
Figure 6.
Figure 6.
Visual DSD simulations of pattern classification with a DNA-only circuit (deterministic simulations, default compilation, no leak). The plots show the temporal response for free outputs Yj to the same patterns as figure 4. We use the concentration for the weights complexes given by the matrix in equation (1.5). [Fuel](0) = [Amplifying gate](0) = 1700 nM, [Threshold gates](0) = 680 nM. For the input concentration, we use c0 = 250 nM. The inputs are injected at t = 0.
Figure 7.
Figure 7.
Stochastic simulations of the effect of leak on the classification (Visual DSD). The plots show the free concentration of outputs in response to the injection of pattern 0110, for various kinetic rates of leak. We selected the just-in-time mode, the directive scale 100 and default compilation. The concentrations for the circuit are identical to figure 6.

References

    1. Benenson Y. 2009. Biocomputers: from test tubes to live cells. Mol. Biosyst. 5, 675–68510.1039/b902484k (doi:10.1039/b902484k) - DOI - DOI - PMC - PubMed
    1. Nandagopal N, Elowitz MB. 2011. Synthetic biology: integrated gene circuits. Science 333, 1244–124810.1126/science.1207084 (doi:10.1126/science.1207084) - DOI - DOI - PMC - PubMed
    1. Hockenberry AJ, Jewett MC. 2012. Synthetic in vitro circuits. Curr. Opin. Chem. Biol. 16, 253–25910.1016/j.cbpa.2012.05.179 (doi:10.1016/j.cbpa.2012.05.179) - DOI - DOI - PMC - PubMed
    1. Rothemund PWK. 2006. Folding DNA to create nanoscale shapes and patterns. Nature 440, 297–30210.1038/nature04586 (doi:10.1038/nature04586) - DOI - DOI - PubMed
    1. Douglas SM, Dietz H, Liedl T, Hogberg B, Graf F, Shih WM. 2009. Self-assembly of DNA into nanoscale three-dimensional shapes. Nature 459, 414–41810.1038/nature08016 (doi:10.1038/nature08016) - DOI - DOI - PMC - PubMed

LinkOut - more resources